
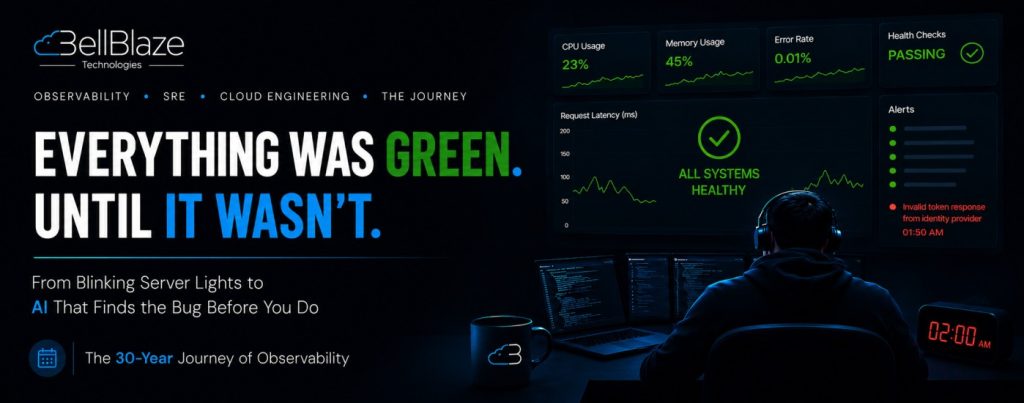
It’s 2 AM. An engineer’s phone rings.
Users can’t log in. Orders aren’t going through. Revenue is bleeding by the minute.
He opens every dashboard he has.
CPU — normal. Memory — fine. Error rates — clean. Health checks — all passing.
Every single metric is green. Yet the application is completely broken.
He stares at those dashboards for forty minutes. Eventually, someone digs into raw logs, finds a line buried ten thousand entries deep, and discovers that a third-party identity provider had started returning malformed tokens, eleven minutes before the incident began.
The infrastructure was healthy. The application was healthy. But a dependency three hops away was silently failing, invisible to everything they had built to watch over their system.
Most of us have never stopped to ask: how did we get here? And how did we finally learn to see inside systems that break in ways we never anticipated?
The 1990s — Engineers Who Listened to Servers
Before dashboards existed, engineers walked to the server room.
They checked the blinking lights. They listened for unusual fan sounds. They placed their hands near the chassis to feel if it was overheating.
Monitoring meant tailing a log file and grepping for errors. Maybe a cron job that pinged a machine and sent a pager alert if it didn’t respond.
It worked because five servers were easy to hold in your head. One ran the database. One ran the application. When something broke, you knew instinctively where to look.
Then the systems started growing.
The 2000s — Watching the Machines
Tools like Nagios, Cacti, and Zabbix gave engineers something genuinely new: graphs over time.
For the first time, you could see that the disk was filling at a predictable rate. You could correlate a CPU spike with a deployment from two hours earlier. You could watch trends instead of reacting to crises.

A server’s CPU could look perfectly flat while the application threw errors on every single request. The disk had space. The network was quiet. From the dashboard, everything was fine.
They were watching the machines. Nobody was watching the software.
Mid 2000s — Moving Up the Stack
New Relic, Dynatrace, and Datadog changed the question engineers were asking.
Not “is the server healthy?” — but “is the code healthy?”
Suddenly, you could see that this HTTP endpoint had an average response time of 240ms. That 95% of that time was spent on one database query. That a specific code path threw a NullPointerException 0.3% of the time.
For the first time, engineers had visibility into what their code was actually doing in production, not just the box it ran on.
It felt comprehensive. For monolithic applications on fixed servers, it largely was.
Then the cloud arrived. And it broke almost everything.
2010s — The Cloud Shattered Every Assumption
Servers used to have names. Histories. You could SSH in, look around, and understand what had happened.
In the cloud, a server could spin up to handle a traffic spike and be gone an hour later. The instance experiencing problems might not exist by the time you go to find it.
And applications were no longer single things. There were fifty microservices, each with its own database, calling each other in chains that no one had fully mapped.

The most important question in engineering, “Why is this request slow?”, became unanswerable.
The industry needed something new. And in 2012, engineers at SoundCloud built it.
2012 — Prometheus Changes Everything
Prometheus didn’t just solve cloud monitoring. It rethought the entire model.
Instead of pushing metrics from agents, Prometheus pulled them — scraping an endpoint on each service on a schedule. If it couldn’t reach a target, it knew immediately. No more guessing whether silence meant health or failure.
Labels replaced rigid naming conventions. PromQL gave engineers a language purpose-built for asking questions of time-series data.
Prometheus became the heartbeat of Kubernetes environments worldwide. It is still, today, the standard.
2016 — Tracing Made the Invisible Visible
Google had quietly built a system called Dapper back in 2010. When they published the paper, the industry finally had a blueprint for what was missing.
Distributed tracing. The ability to follow a single request — one user clicking “Buy” — across every service it touched, with precise timing for every step.
Instead of forty minutes of log archaeology, an engineer could now open a trace and see:
Payment service — 7,680ms. Stripe API call — 7,650ms.
In five seconds, the culprit was visible. The investigation that once took an hour took four minutes.
Jaeger, Zipkin, and the entire tracing ecosystem that followed were built on this one idea: make the path of a request something you can actually see.
2019 — One Standard to Unite Them All
By the late 2010s, every APM vendor had their own instrumentation libraries. Switching backends meant re-instrumenting your entire codebase. Teams were locked in by the very tools meant to help them.
OpenTelemetry ended that.
One vendor-neutral standard for metrics, logs, and traces. Instrument once. Send to any backend. The OTel Collector sits between your applications and your observability platform — reconfigure it without touching a single line of application code.
It graduated as a CNCF project in 2024. Every major platform: Datadog, Grafana Labs, New Relic, and honeycomb.io now accepts it. The fragmentation problem is solved.
Today — Systems That See Themselves
AI is now doing what no dashboard ever could.
Anomaly detection that learns your system’s normal behaviour — accounting for time-of-day patterns and deployment-driven shifts — and alerts when something deviates before it breaks.
Root cause analysis that looks at cascading failures across dozens of services and tells you which one started it.
LLM-powered investigation where an on-call engineer asks in plain English: “What changed in the payment service around the time this error rate spiked?” — and gets an answer.
The long-term trajectory is toward self-healing systems. Infrastructure and applications that detect their own problems and repair them without waking anyone up at 2 AM.
We are not fully there yet. But the path there runs through better observability — and the tools are improving faster than ever.
Every generation of monitoring solved the most painful problem of its era. And in doing so, revealed a new class of problem the next generation had to address.
That is how this has always worked. The systems got harder. The tools got smarter. The need never changed.
Engineers are trying to understand what their systems are doing. And why.
Observability today is what networking was in the 1990s — a foundational infrastructure concern that underpins everything else. Within a few years, running production systems without it will feel as reckless as running them without network monitoring.
At Bell Blaze Technologies, observability isn’t something we add to a system after it’s built. It’s designed in from day one — Prometheus , Grafana Labs , OpenTelemetry , distributed tracing and the AI layer on top — so that when something breaks at 2 AM, your engineers spend four minutes finding it. Not forty.
Where is your system on this journey right now? And what’s the gap you’re most frustrated by: the metrics, the logs, the tracing, or something else entirely?
#Observability #SRE #DevOps #Kubernetes #Prometheus #OpenTelemetry #CloudNative #DistributedSystems #AIOps #AWS #PlatformEngineering #BellBlaze