

An Engineering Investigation into OpenTelemetry Export Under Apache Prefork
Contents
- Abstract
- Summary
- 1. Introduction
- 2. The Problem
- 3. Why Perl Needs Manual Instrumentation
- 4. Why Apache/mod_perl Is Different
- 5. The Original Implementation
- 6. The Original Diagnosis: “Perl Cannot Export OTLP”
- 7. Community Research
- 8. Alternative Approaches Investigated
- 9. The Layered Diagnostic Model
- 10. The Reference Implementation
- 11. Isolating the Export Failure
- 12. Why the Final Architecture Works
- 13. Hardening the Design: Findings from a Second Environment
- 14. Final Architecture and Trace Lifecycle
- 15. Implementation Guide
- 16. Validation
- 17. Troubleshooting Guide
- 18. Performance Considerations
- 19. Limitations
- 20. What This Investigation Taught Us
- 21. Future Work
- 22. Conclusion
- References
Abstract
Adding distributed tracing to a Perl application running under Apache/mod_perl is harder than the available OpenTelemetry examples suggest. Languages such as Java and Python can be traced by an agent with no code changes. Perl needs its request handling instrumented by hand, and mod_perl’s process model adds problems that standalone examples never meet.
This article documents how end-to-end tracing was achieved. An initial implementation instrumented the application fully, yet no span ever reached the tracing backend, and the export path was concluded to be a limitation of the Perl ecosystem. Several alternative backends and pipelines then failed in exactly the same way.
A reference implementation then produced complete traces spanning Perl, a Node.js service and a MariaDB database, visualised in Grafana through Grafana Alloy and Tempo. Controlled testing located the blocker inside the mod_perl worker process: spans were created but never left it.
A second round of testing, in an independent environment, turned that working result into a hardened design. It found four further silent failures under mod_perl, each of which produces no error: environment variables that are invisible at start-up, a child-init hook that never runs, an export path with no effective timeout, and a 40 ms network stall on every request. The article explains each one, gives the fix, and provides complete, tested code for the final design.
Summary
End-to-end distributed tracing works for Perl applications running under Apache/mod_perl, using the standard OpenTelemetry Perl SDK. What makes it look impossible is a series of silent failures specific to mod_perl.
The problem. A legacy Perl 5.32 application on Apache/mod_perl needed request-level tracing. The application was fully instrumented, but no trace ever reached the backend, and the conclusion was that Perl could not export OpenTelemetry traces.
What was tried. Alternative pipelines (OpenTelemetry Collector with Elastic APM, Vector), alternative backends (Jaeger, Zipkin, Tempo, New Relic, Splunk), proxy-based and coarse-grained monitoring, and a discussion with the Perl Monks community. None produced application traces.
What was found. The failure was not in the backend and not a fundamental Perl limitation. Spans were created inside each Apache worker but never sent. The SDK’s batch span processor has no working timer; it exports only when 512 spans have queued or when explicitly flushed. Nothing reports an error, which is why it looks like a transport problem.
Why every backend failed. Every approach sat downstream of the point where spans were lost. Changing the destination cannot help while nothing leaves the application.
The final design. Each Apache worker initialises the SDK once after it is forked, and exports the spans of each request in one call when the request ends. Five configuration details make it work, each verified: PerlPassEnv instead of PassEnv, the child-init hook at server level, a per-request span processor, an explicit export timeout, and TCP_NODELAY on the exporter’s connections.
The result. One trace spans Apache/mod_perl, database queries, an outbound HTTP call and a Node.js service. In testing, 300 concurrent requests produced every expected span with no errors. Tracing adds about 5 ms per request. A receiver outage costs nothing, and an unreachable receiver costs at most the configured timeout. A tracing misconfiguration disables tracing without affecting the application.
Significance. Legacy Perl/mod_perl applications can adopt standard OpenTelemetry tracing incrementally, without rewriting the application. We did not find published guidance covering these mod_perl failure modes.
1. Introduction
This article is a case study and a reference implementation. It records how distributed tracing was achieved for a Perl application under Apache/mod_perl, including the approaches that failed.
The failed approaches are kept deliberately. An engineer facing the same problem is likely to try the same things in roughly the same order. Knowing why each one failed, and where in the pipeline it failed, is more useful than knowing only what finally worked.
The central contribution is diagnostic. A tracing pipeline has three layers that fail independently, and a failure in the middle layer looks, from outside, exactly like a failure in the other two. Most of the effort described here went into changing components in a layer that was already working.
The second contribution is practical. Section 15 is a complete implementation guide: every file of the final design, explained line by line, exactly as it was tested.
2. The Problem
The requirement was application-level distributed tracing: spans created inside the Perl application, correlated across service boundaries and visible in a tracing backend. Infrastructure metrics and logs were out of scope.
| Aspect | Detail |
|---|---|
| Language | Perl 5.32, legacy codebase |
| Web server | Apache HTTP Server with mod_perl |
| Request dispatch | HTML::Mason, using a syshandler-based request lifecycle |
| Platform | Kubernetes |
| Dependencies | Database, cache, session handling and third-party integrations |
| Original target backend | Elastic APM, through the OpenTelemetry Collector |
The question was simple to state: is distributed tracing for legacy Perl applications realistically possible today? The requirement was not only to create spans, but to get them out of the Perl runtime reliably and to visualise them.
That three-part framing turned out to matter more than any single technology choice. Section 9 develops it into the diagnostic model used throughout.
3. Why Perl Needs Manual Instrumentation
In most mainstream languages, OpenTelemetry tracing can be switched on without touching application code. Perl has no equivalent, so the request entry point and any business spans have to be written by hand.
3.1 Zero-code instrumentation in other languages
OpenTelemetry’s zero-code instrumentation adds the API and SDK to an application as an agent or agent-like installation, using bytecode manipulation, monkey patching or eBPF depending on the language (OpenTelemetry: zero-code). In Java, an agent JAR attached to the JVM captures inbound requests, outbound HTTP calls and database calls with no code changes (OpenTelemetry: Java agent). Python applications are typically started through the opentelemetry-instrument wrapper, which patches supported frameworks at runtime (SigNoz).
The Node.js service in this article shows the same pattern: one bootstrap file loads @opentelemetry/auto-instrumentations-node, and every inbound request and Express handler is traced automatically (Section 15.11).
| Language | How tracing is switched on | Application code to write |
|---|---|---|
| Java | Agent JAR attached with -javaagent | None |
| Python | opentelemetry-instrument wrapper | None |
| Node.js | Auto-instrumentations package loaded at startup | One bootstrap file |
| Perl | SDK and library instrumentation loaded explicitly | Request entry point, context activation, flush, business spans |
3.2 What the Perl distribution provides
The OpenTelemetry Perl distribution includes library instrumentation for DBI, HTTP::Tiny and LWP::UserAgent. Once imported, database queries and outbound HTTP calls produce client spans, and LWP injects traceparent into outgoing requests.
No instrumentation for Apache/mod_perl, PSGI or HTML::Mason request handling was found in the distribution. Whatever receives the request must open the trace itself.
3.3 What has to be written by hand
Four pieces of code are needed. Section 15 gives each one in full, as tested.
1. Initialise the SDK once per worker, after Apache has forked it. Registered as the PerlChildInitHandler:
require OpenTelemetry::SDK;
OpenTelemetry::SDK->import;
2. Enable library instrumentation for the libraries the application uses:
require OpenTelemetry::Instrumentation;
OpenTelemetry::Instrumentation->import(qw(DBI LWP::UserAgent));
3. Open a server span for each request, continuing any incoming trace, and make it the active context so that library spans nest beneath it:
my $parent = OpenTelemetry->propagator->extract(
    $headers, undef, sub { $_[0]->{ lc $_[1] } });

my $span = $tracer->create_span(
    name   => "$method $route",
    kind   => SPAN_KIND_SERVER,
    parent => $parent,
);

dynamically otel_current_context = otel_context_with_span($span);
4. End the span and export the request’s spans once the response has been written:
$span->end;
OpenTelemetry->tracer_provider->force_flush->get;
Business-logic spans are created the same way as in step 3, with SPAN_KIND_INTERNAL. Step 4 is the part most examples omit, and under mod_perl it is not optional (Section 11).
4. Why Apache/mod_perl Is Different
Most OpenTelemetry examples assume one of two process models: a short-lived script that exits, or a long-lived server with its own event loop. Apache/mod_perl under the prefork MPM is neither, and that is the root of every difficulty in this article.
4.1 The process lifecycle
During the post-config phase, mod_perl starts Perl and runs any registered PerlRequire and PerlModule entries, in the parent process. Apache then restarts itself immediately after startup, so everything running at server startup is executed twice (mod_perl: server life cycle handlers).
Worker processes are then forked from the parent, and PerlChildInitHandler handlers run once in each child at the start of its life (same source).
END {} blocks are executed by the parent process and by each child process, because children inherit them on fork. The exact behaviour depends on the MPM (same source).
Three consequences follow for any telemetry SDK:
- Anything created in
startup.plexists in the parent and is copied into every worker byfork(). Background timers, event loops, sockets and in-memory queues are all duplicated. None of them is designed to be shared across processes this way. - Startup code runs twice. The startup log line appears twice on every start.
ENDblocks are not a per-request hook. They run only when a process exits. A long-lived worker can hold unsent spans for its whole life.
4.2 The environment is not where you expect it
Apache does not expose the container or process environment to Perl by default. Each variable must be passed through explicitly, and the choice of directive matters.
Variables passed with Apache’s PassEnv reach Perl’s %ENV only while a request is being handled. During startup.pl and during PerlChildInitHandler they are absent. With mod_perl’s PerlPassEnv, the same variables are visible at both stages.
| Stage | Variable visible with PassEnv | Variable visible with PerlPassEnv |
|---|---|---|
startup.pl (parent) | No | Yes |
PerlChildInitHandler (each worker) | No | Yes |
| During a request | Yes | Yes |
OpenTelemetry is configured through environment variables, and the SDK falls back silently to defaults when they are missing. With PassEnv, an SDK initialised in child-init therefore exports to a default endpoint: the SDK’s own, or whatever default the application supplies. Nothing reports an error. Where the default happens to match the real endpoint, the defect is invisible.
4.3 The child-init hook must be at server level
A PerlChildInitHandler placed inside <VirtualHost> did not run: no worker executed it at start-up. Placed at server level, outside any virtual host, it ran once in each of the five workers before the first request. Child-init is a per-process event, not a per-host one.
4.4 Telemetry must never take down the server
A handler that throws brings down the request; a failure at startup can prevent Apache from starting at all. From SDK 0.025, the SDK dies if it encounters an error during initialisation, though once loaded it will never intentionally raise an exception (SDK 0.025 changes).
Setting OTEL_EXPORTER_OTLP_PROTOCOL=grpc, a realistic mistake, makes SDK initialisation die with unsupported protocol for OTLP exporter: grpc. Initialisation therefore needs a defensive wrapper, which is what the OTEL.pm abstraction in Section 5 introduced and the final design keeps (Section 15.8).
4.5 Why standard examples mislead
A standalone Perl script that creates a span and calls force_flush exports it at once. The same code moved into a mod_perl handler, without the flush, appears to work, raises no error, and exports nothing. Nothing in the failure points at the process model, which is why it is so easily mistaken for a transport problem.
5. The Original Implementation
The original implementation succeeded at instrumentation and failed at export. Its design choices were sound, and several of them carry directly into the final solution.
5.1 Target architecture
The intended pipeline ran from the Perl application, through OpenTelemetry instrumentation, to an OpenTelemetry Collector in a dedicated observability namespace, and from there to Elastic APM. The Collector exposed OTLP receivers on port 4317 (gRPC) and 4318 (HTTP). Section 14 shows this architecture as a diagram.
5.2 Instrumentation scope
The Mason syshandler was identified as the right place for root request spans, context propagation and span hierarchy. Manual spans were created for:
- the HTTP request lifecycle, with the root span stored in
pnotesfor the duration of the request - database calls
- cache operations
- session handling
- business logic blocks
Parent-child relationships were maintained across these spans, with cleanup at the end of each request. The database spans could equally have come from the DBI instrumentation described in Section 3.2.
5.3 The OTEL.pm abstraction
A custom OTEL.pm module sat between the application and the OpenTelemetry API. It was built on one principle: observability must never become a single point of application failure.
| Capability | Purpose |
|---|---|
| NO-OP tracer fallback | If OpenTelemetry dependencies are missing or fail to load, the application still runs, with telemetry disabled |
| Conditional real tracer | A real tracer is initialised only when its dependencies are present |
| Stable span API | start_span, set_attribute, set_status, end and finish, so application code never calls the SDK directly |
| Crash isolation | A telemetry failure cannot raise an exception into an Apache handler |
This is the right pattern for any mod_perl deployment, and the final design keeps it. Because SDK 0.025 and later die on initialisation errors (Section 4.4), a wrapper of this kind is a requirement rather than a precaution.
5.4 Runtime changes
The Dockerfile installed the OpenTelemetry Perl dependencies, added OTEL.pm and set PERL5LIB. The startup file was changed to modify @INC early, set OpenTelemetry environment variables and initialise OpenTelemetry safely, in the order initialisation, loading, execution.
Initialising OpenTelemetry in the startup file places it in the Apache parent process, before workers are forked (Section 4.1). Section 13.5 returns to why that matters.
5.5 Problems solved along the way
| Problem | Resolution |
|---|---|
| Apache crashing on missing span methods | NO-OP spans |
| Module loading failures | @INC and Dockerfile changes |
| Deprecated OpenTelemetry APIs | Migrated to supported SDK patterns |
| Span lifecycle mismatches | Normalised across the codebase |
A request-level flush was also added, yet spans still did not arrive. Section 13.5 explains why the choice of flush call is decisive.
5.6 Where it stood
The application was fully instrumented, spans were generated throughout the request lifecycle, Apache and mod_perl were stable, the Collector was healthy and network connectivity was verified. The Elastic APM indices remained empty. In the terms of Section 9, Layer 1 was solved and Layer 2 was not.
6. The Original Diagnosis: “Perl Cannot Export OTLP”
The original conclusion was that Perl cannot reliably export OTLP traces, and that this was a language ecosystem limitation rather than a configuration issue. Later evidence supports part of that conclusion and contradicts the rest.
6.1 The original assessment
OTLP defines three transports. Each was assessed as follows:
| Transport | Original assessment |
|---|---|
| gRPC | Not supported: no viable Perl gRPC client ecosystem, and no gRPC exporter in the Perl SDK |
| HTTP with JSON | The Perl JSON OTLP encoder is incomplete |
| HTTP with Protobuf | Requires runtime .proto compilation via Google::ProtocolBuffers::Dynamic, not feasible in production |
The assessment added that OTLP wire-format compliance could not be achieved from Perl. Collector logs showed receivers active and pipelines running, while the Elastic APM indices stayed empty.
6.2 Each finding against later evidence
| Transport | Later evidence | Assessment |
|---|---|---|
| gRPC | The exporter is built on HTTP::Tiny; no gRPC transport exists | Finding holds |
| HTTP with JSON | Encoder defects were fixed in 0.014 (timestamps, span and trace IDs, string values), 0.015 (parent span ID key name) and 0.016 (status messages as strings) (exporter changes). Exporter 0.021 JSON output was accepted by an OTLP receiver and stored in Tempo with correct parent-child relationships, in two independent environments | Resolved in current releases |
| HTTP with Protobuf | The exporter uses Google::ProtocolBuffers::Dynamic if available and JSON otherwise (SDK 0.025). Bindings may be generated ahead of time with protoc-gen-perl-gpd (Section 7). Not tested | Open |
6.3 The version question
Exporter 0.021 was already the current release when the original work was done, and it still is (exporter changes). Every JSON encoder fix listed above shipped several releases earlier. An install from CPAN would therefore have received the same exporter that works in this article, which makes the JSON encoder an unlikely cause of the original failure.
6.4 What the diagnosis could not distinguish
The original work correctly separated instrumentation from export. That separation is the foundation of this article.
What the available evidence could not tell apart was two different failures:
- Export was attempted and rejected. Spans reached the network, but the payload was malformed or refused.
- Export was never attempted. Spans were created and then stayed inside the worker process.
From the Collector’s side these are identical: healthy receivers, running pipelines, zero spans. Neither produces an error in the backend. The original diagnosis chose the first explanation. Section 11 shows that the second was correct.
6.5 What should have been measured
The exporter itself can answer the question. It emits otel.exporter.otlp.success and otel.exporter.otlp.failure metrics, and logs internal messages to STDERR, with verbosity controlled by OTEL_PERL_INTERNAL_LOG_LEVEL (exporter changes).
A zero success count and a zero failure count means no export was ever attempted. That single observation separates the two explanations above. On the receiving side, the OpenTelemetry Collector and Grafana Alloy both expose an accepted-spans counter, otelcol_receiver_accepted_spans_total, which answers the same question from the other end.
7. Community Research
To test the conclusion, the question was put to practitioners with Perl production experience on Perl Monks. The community did not supply the solution, but two of its three replies raised the two questions that turned out to be worth asking.
7.1 The question
The question Is distributed tracing / APM realistically possible for legacy Perl applications? was posted on a technical forum and front-paged by the site editors.
It stated the goal as application tracing only: creating traces and spans inside the Perl application and exporting them to Jaeger, Zipkin, Tempo or an APM platform. It restated the findings on gRPC, JSON and Protobuf, noted that Jaeger and Zipkin are backends that cannot generate spans themselves, and asked five questions:
- Is true distributed tracing for Perl applications realistically possible today?
- Are there recommended Perl modules for exporting traces in non-OTLP formats, such as Jaeger Thrift or Zipkin HTTP?
- Are there platforms or vendors that support Perl tracing in production?
- Are proxy- or gateway-based approaches, such as Nginx or Envoy, the recommended alternative?
- What is the most practical way to achieve observability for Perl services?
7.2 The replies
| Respondent | Substance | Status after this investigation |
|---|---|---|
| Corion | Pointed out that Google::ProtocolBuffers::Dynamic claims to support ahead-of-time generation via protoc-gen-perl-gpd. Explicitly offered as an untested idea | Challenges the premise that Protobuf needs runtime compilation |
| hippo | Asked whether the post referred to OpenTelemetry::Exporter::OTLP::Encoder::JSON, noted that it had no open issues, and suggested raising one or contributing a fix | A useful pointer. The JSON encoder did have defects, fixed in releases 0.014 to 0.016; they do not affect 0.021, the version verified here |
| perlink | Considered the conclusion reasonable. Stated that application-level Perl tracing is not a mature capability and that most organisations rely on proxy-based tracing, external request correlation or coarse-grained monitoring | One practitioner’s reported experience. Led directly to the approaches in Section 8 |
7.3 Reading the replies again
Read together, the replies were not a uniform endorsement. perlink agreed with the conclusion. Corion questioned the Protobuf constraint. hippo questioned the JSON encoder claim, and did so with a checkable fact: the encoder had no open issues.
hippo’s observation was the most useful thing the community said. If a widely used encoder had a defect severe enough to block all export, someone would normally have reported it. The absence of reports was weak evidence that the encoder worked and the problem lay elsewhere. That turned out to be true.
8. Alternative Approaches Investigated
Twelve approaches were tried, and only the last produced application traces. The attempts were exploratory and were not formally recorded, so the reasons below are reconstructed from the root cause identified in Section 11 rather than from logs of each attempt.
8.1 What was tried, and why it produced no traces
| # | Approach | Layer changed | Why it produced no application traces |
|---|---|---|---|
| A | OpenTelemetry Collector to Elastic APM | Backend | The Collector was healthy, but the Perl workers never sent spans, so there was nothing to forward |
| B | OpenTelemetry Collector with other ELK combinations | Backend | As A: a different destination behind the same silent source |
| C | Vector as the telemetry pipeline | Pipeline | Vector runs outside the Perl process. It can only route data it receives, and none arrived |
| D | Jaeger | Backend | Jaeger stores and displays spans; it cannot create them. With nothing exported from Perl, it had nothing to store |
| E | Zipkin | Backend | As Jaeger. A Zipkin-format exporter would not have helped either, because the spans were lost before any exporter ran |
| F | Tempo, via the OpenTelemetry Collector | Backend | Tempo later received Perl spans once the application flushed them, so Tempo itself was never the problem |
| G | Proxy-based tracing, for example Nginx or Envoy | Bypasses the application | Produces spans at the network edge only. It cannot see database calls, cache, sessions or business logic inside Perl, which the requirement needed |
| H | Gateway-based tracing | Bypasses the application | As G: request-level visibility, no application internals |
| I | Coarse-grained monitoring | Replaces tracing | Does not provide spans, by design |
| J | Splunk agents | Pipeline or backend | Receiving from the same Perl SDK, it inherited the same silent loss |
| K | New Relic | Backend | Receiving from the same Perl SDK, it inherited the same silent loss |
| L | Grafana Alloy, Tempo and Grafana, with application-side changes | Export and backend together | Worked. The export layer was fixed in the same step (Section 11) |
8.2 The pattern in the matrix
Approaches A to F, J and K all changed what received the spans. None changed whether spans left the worker. If spans never left the process, every one of them was bound to fail in exactly the same way, regardless of the product.
This is interpretation, but it is strongly supported. Eight approaches across seven vendors and projects produced one identical symptom. A defect in any single backend would not produce that pattern. A failure upstream of all of them would.
Approach L succeeded, and it is the only row where the application itself also changed. Section 12 separates those two changes.
8.3 Application-level instrumentation versus proxy and gateway tracing
Approaches G and H asked a fair question: if spans cannot be exported from inside Perl, can tracing be done around it?
A proxy or gateway sees the request at the network boundary. It can record the route, method, status code and total latency, and can inject W3C trace context before forwarding. That gives a real span, and it correlates across services.
It cannot see inside the application. Specifically, it loses:
- database queries, their duration and their errors
- cache and session operations
- business-logic spans and their timing
- exceptions raised inside the handler, and their cause
- the order and nesting of work within a request
A proxy can report that a request returned HTTP 500. It cannot report that the cause was an unknown column in a specific SQL statement. That is why G and H did not meet the requirement here. It is not a claim that proxy tracing is ineffective in general.
The two are complementary. In the final implementation the application extracts incoming traceparent headers (Section 14), so a proxy can open the root span and the Perl application can continue the same trace beneath it.
9. The Layered Diagnostic Model
A tracing pipeline has three layers, and each can fail while the others work. Separating them is the most useful idea in this article.
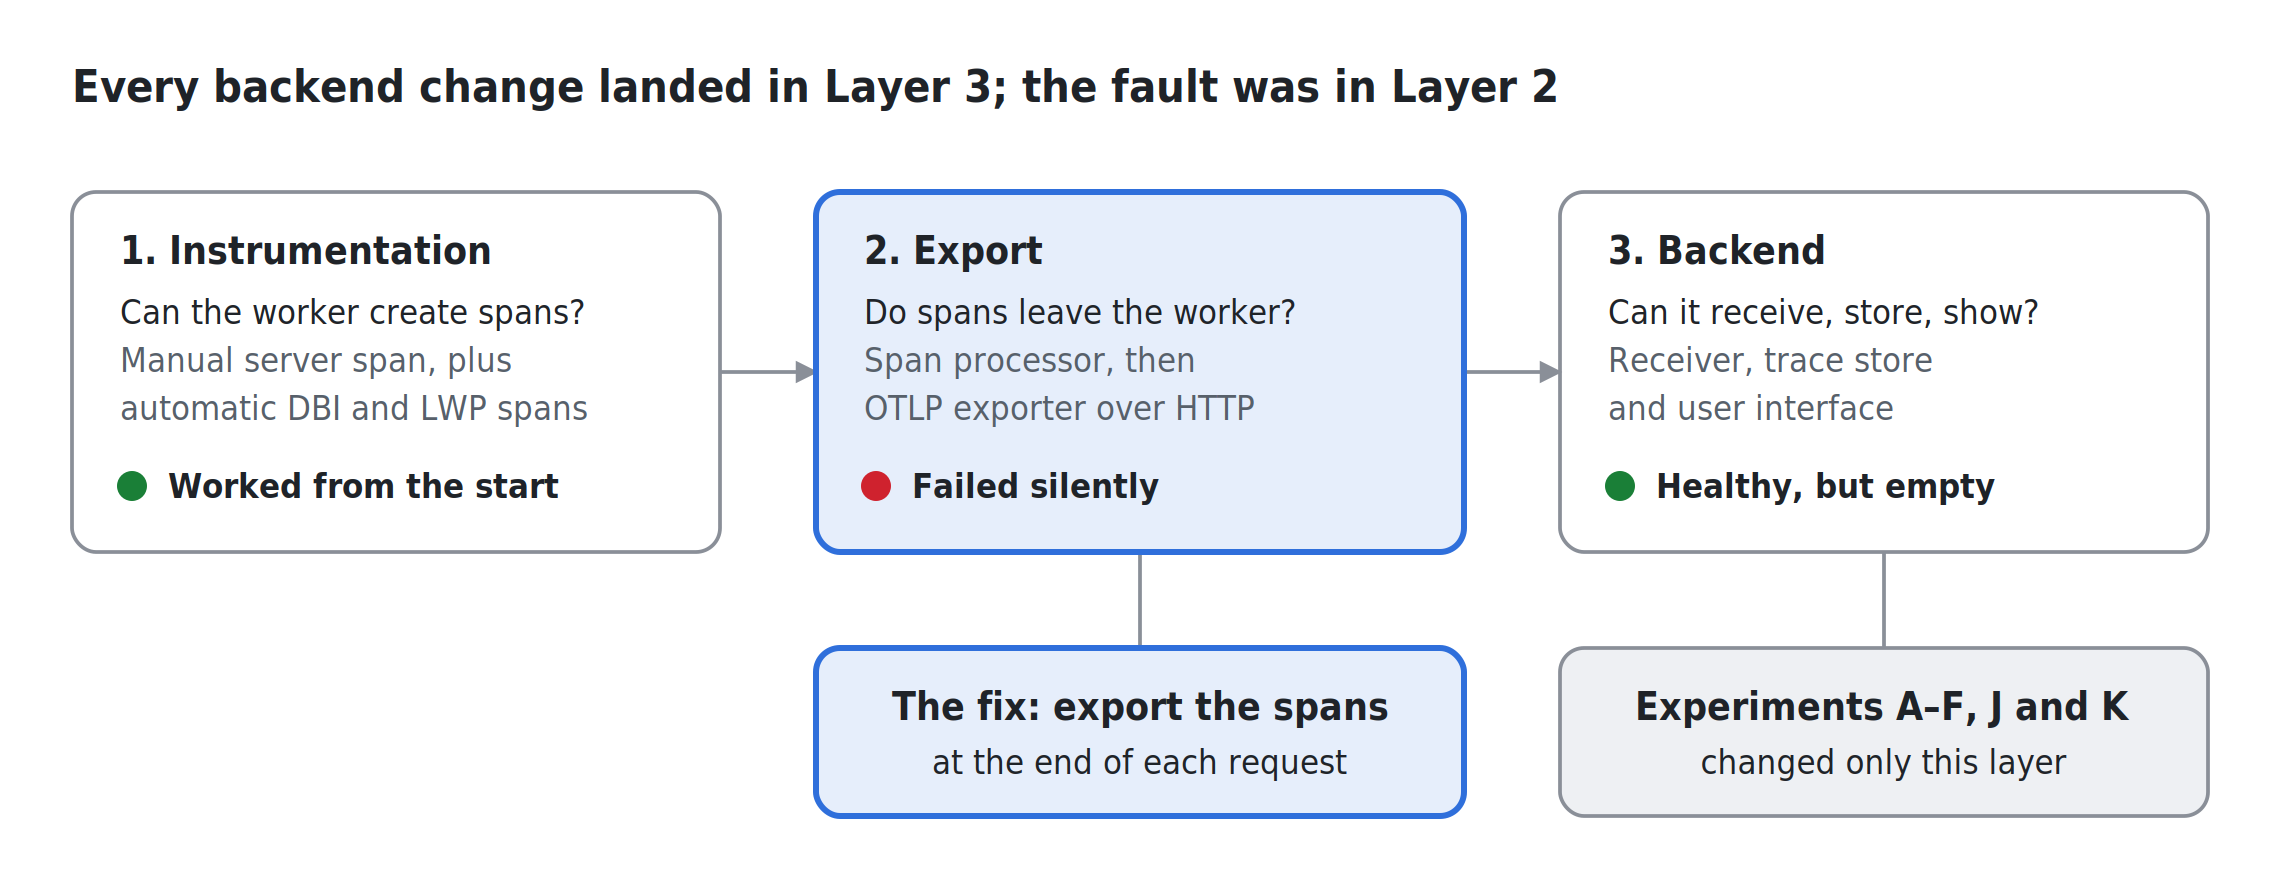
In the original implementation, Layer 1 worked and Layer 3 was healthy. That left Layer 2 as the only place the spans could have been lost. Every alternative in Section 8 replaced part of Layer 3; the fix in Section 11 was in Layer 2.
| Layer | Question | Proof that it works | What its failure looks like |
|---|---|---|---|
| 1. Instrumentation | Does the worker create correctly nested spans? | The console exporter prints them, parented correctly | No spans, or unrelated root spans |
| 2. Export | Do the spans leave the worker? | The receiver’s accepted-spans counter rises; spans reach a receiver you control | Backend empty, no error anywhere |
| 3. Backend | Can it receive, store and display spans? | A synthetic span posted to the receiver can be read back | Backend empty, usually with an error at the receiver or store |
Layers 2 and 3 share the symptom that matters most: an empty backend. The difference is that a Layer 3 failure usually leaves an error somewhere, and a Layer 2 failure need not.
The layers should therefore be proven from the outside in. Prove Layer 3 with a synthetic span, then Layer 1 with the console exporter. Whatever remains unproven is where the fault lies. Section 17 turns this into a troubleshooting procedure.
10. The Reference Implementation
A small reference implementation was built to reproduce the runtime, so that one variable could be changed at a time. It is the source of the findings in Sections 11 and 12. Section 13 describes a second, independent environment used to harden the design.
10.1 Environment
The implementation ran Perl 5.32.1 under Apache 2.4.67 with mod_perl 2 and the prefork MPM, on Debian 11, in Docker. Debian 11 was chosen because its packages provide Perl 5.32 and libapache2-mod-perl2 built against the same system Perl; the official perl:5.32 image would add a second interpreter that Debian’s mod_perl does not use.
10.2 Two feasibility gates
Before any application code was written, two gates were checked.
- Base environment. Debian 11.11 repositories resolved, and Perl reported v5.32.1.
- SDK installation.
cpanminstalled 45 distributions. The installed versions were OpenTelemetry API 0.036, OpenTelemetry::SDK 0.028 and OpenTelemetry::Exporter::OTLP 0.021, andOpenTelemetry::Instrumentation::DBIloaded successfully. IO::Async was pulled in as a dependency.
10.3 Components
| Component | Technology | Role |
|---|---|---|
order-api | Perl, Apache prefork, mod_perl 2 | The system under test |
pricing-api | Node.js 20, Express, OpenTelemetry JS SDK | Downstream service, for the cross-language hop |
| Database | MariaDB, TLS required | Target for auto-instrumented DBI spans |
| Receiver | Grafana Alloy | OTLP receiver, batching, forwarding |
| Trace store | Grafana Tempo 2.10.5 | Storage and query |
| Visualisation | Grafana | Trace search and display |
10.4 Endpoints
| Endpoint | Purpose |
|---|---|
GET /health | Liveness |
GET /orders | Database read with a join |
GET /order-detail?id=N | The deepest path: database read, then an HTTP call to pricing-api |
GET /test/db-error | A controlled, read-only SQL failure against a column that does not exist |
10.5 Which spans are manual and which are automatic
| Span | Created by |
|---|---|
HTTP server span for the request, including traceparent extraction | Manual, in the response handler |
pricing.lookup business span | Manual |
connect and SQL statement spans | Automatic, OpenTelemetry::Instrumentation::DBI |
Outbound GET span, including traceparent injection | Automatic, OpenTelemetry::Instrumentation::LWP::UserAgent |
Only the request entry point and deliberate business spans are written by hand, as described in Section 3.3.
10.6 API validation
The SDK is pre-1.0, so its API was validated with a stepwise probe before the handler was written, each call wrapped in eval. Fourteen of fifteen calls succeeded, including tracer creation, span creation, attribute setting, status, force_flush and shutdown.
The one failure was informative. OpenTelemetry::Context->attach does not exist. The Perl API activates context by assigning to the lvalue function otel_current_context, scoped with dynamically from Syntax::Keyword::Dynamically, which must be installed explicitly.
This matters for trace structure. Under standard OpenTelemetry semantics, a span created with no active parent in the current context becomes a new root. Without correct activation, the automatic DBI and LWP spans would appear as separate traces rather than as children of the request.
11. Isolating the Export Failure
The reference implementation reproduced the original symptom exactly, then removed it with a single change inside the Perl process. The receiver, trace store, network and configuration were identical in the failing and passing runs.
11.1 The observations, in order
| # | Test | Result |
|---|---|---|
| 1 | CLI probe: create a span, then call force_flush and shutdown | Span stored in Tempo and retrievable by trace ID |
| 2 | CLI probe with console exporter: traceparent supplied, server span activated, DBI query and LWP call made | Three spans printed, all on the supplied trace ID, DBI and LWP spans correctly parented under the server span |
| 3 | Same probe with OTLP export, shutdown only | No spans in Tempo |
| 4 | mod_perl application, request sent with a known traceparent, no explicit flush | pricing-api spans present on the trace ID. No order-api spans |
| 5 | Test 4 repeated with one change: explicit force_flush after the response is written | order-api server span, pricing.lookup, DBI connect and SELECT, and LWP GET all present on the trace, alongside pricing-api |
11.2 What tests 4 and 5 prove
Test 4 is the most informative result in the investigation. It proves three things at once:
- Context propagation works.
pricing-apireceived the trace ID that was sent toorder-api. The only path by which it could arrive is thetraceparentheader injected by the auto-instrumented LWP call inside Perl. That call can only have injected it if Perl had extracted the context, created the server span and activated it. - The receiver and trace store work. Spans from
pricing-apiarrived through the same Alloy instance and landed in the same Tempo. - Perl spans were created but not exported. The injected header proves the spans existed. None arrived.
That is precisely the original symptom: instrumentation working, receiver healthy, backend empty, and no error anywhere.
Test 5 changed exactly one thing, adding the flush, and every expected Perl span appeared. The cause lies in the export layer, inside the worker process.
11.3 Shutdown does not export queued spans
Test 3 was confounded when first observed. It was later isolated in a single-variable test (Test E, Section 16): two scripts identical except for their last call, each queuing three spans with the SDK’s stock batch processor.
| Final call | Return value | Spans accepted by the receiver |
|---|---|---|
shutdown | success | 0 |
force_flush | success | 3 |
In SDK 0.028, shutdown discards the queue and reports success. The source shows why: shutdown marks the processor as done before calling force_flush, which then returns immediately because the processor is done.
11.4 Other defects found on the way
None of these is a telemetry defect, but each produced a failure that looked unrelated to its cause.
| Symptom | Cause | Fix |
|---|---|---|
| HTTP 403 on every route | Debian’s default apache2.conf denies access to /; the handler directory sat outside /var/www | <Directory> block with Require all granted |
| DBI connecting to a local socket with an empty host | Apache did not pass container environment variables to mod_perl | An explicit pass-through directive per variable (Section 4.2) |
AH01506: PassEnv variable ... was undefined, with variable names run together | Directives ending in a backslash were joined into one | One directive per line, no continuations |
ER_SECURE_TRANSPORT_REQUIRED | The database required TLS | mariadb_ssl=1 and the CA bundle in the DBI DSN |
| No error, no spans, at the default log level | OTEL_EXPORTER_OTLP_ENDPOINT pointed HTTP/JSON at the gRPC port 4317 | Use port 4318 with an HTTP protocol |
12. Why the Final Architecture Works
The final architecture works because each Perl worker now sends its spans at the end of each request. Grafana Alloy, Tempo and Grafana form a correct and effective backend, but the success does not depend on them: the receiver was identical in the failing and passing runs.
12.1 The controlled comparison
| Run | Receiver | Trace store | Perl application | Perl spans in Tempo |
|---|---|---|---|---|
| Test 4 | Grafana Alloy | Tempo 2.10.5 | No explicit flush | None |
| Test 5 | Grafana Alloy, unchanged | Tempo 2.10.5, unchanged | force_flush after each response | All expected spans |
Only the application changed. That isolates the cause to the export layer inside the worker.
12.2 What Alloy contributed
Alloy’s otelcol.receiver.otlp component is a wrapper over the upstream OpenTelemetry Collector OTLP receiver (Alloy documentation). Alloy describes itself as a distribution of the OpenTelemetry Collector (Alloy repository).
Alloy needed no Perl-specific configuration: a standard OTLP receiver, a batch processor and an exporter to Tempo (Section 15.3). It performed its role correctly and integrates cleanly with Tempo and Grafana. The change that made the difference was in the application.
12.3 Why flushing was necessary
In SDK 0.028 the batch span processor reads OTEL_BSP_SCHEDULE_DELAY into a field and never uses it. There is no timer. The processor exports only when its queue reaches the batch size, 512 spans by default, or when force_flush is called.
The reference implementation set OTEL_BSP_SCHEDULE_DELAY to 2000 milliseconds. In test 4, spans had still not been exported 12 seconds after the request. That is what an unused setting looks like.
A single request produces a handful of spans, far below 512, so without a flush they wait indefinitely. Under heavy traffic a worker would eventually fill a batch, so spans would arrive late and in bursts, and any still queued when the worker exits would be lost (Section 11.3).
The OpenTelemetry specification anticipates this situation. It says ForceFlush should be called only when necessary, for example with FaaS providers that may suspend the process after an invocation but before the processor exports (OpenTelemetry tracing SDK specification). A mod_perl worker idle between requests is, in this respect, the same case.
12.4 Responsibilities in the working pipeline
| Question | Answer |
|---|---|
| Which components generate spans? | The Perl SDK in each Apache worker: the manual server and business spans, and the automatic DBI and LWP spans. The OpenTelemetry JS SDK in pricing-api |
| Which components transport them? | The Perl OTLP exporter, over HTTP::Tiny, sending OTLP/HTTP with JSON encoding to Alloy on port 4318. The Node.js exporter, sending OTLP/gRPC to Alloy on port 4317 |
| Where is telemetry transformed? | Alloy’s receiver decodes the incoming OTLP into the Collector’s internal representation; its exporter re-encodes it as OTLP/gRPC to Tempo. A standard Collector does the same |
| Which component stores traces? | Tempo, on local disk, with seven-day retention |
| Which component queries and displays them? | Grafana, through its Tempo data source |
| What responsibility moved away from Perl? | None. Perl still encodes and transmits its own spans. The fix made it actually do so |
13. Hardening the Design: Findings from a Second Environment
A working trace is not yet a design fit for real traffic. The code was therefore rebuilt from scratch in a second, independent environment and put through a test series covering failure, load and misconfiguration. It found four further silent failures. Each was fixed and re-tested, and the final design in Sections 14 and 15 is the result.
13.1 The second environment
| Component | Version |
|---|---|
| Operating system | Ubuntu 24.04 |
| Perl | 5.38.2 |
| Apache HTTP Server and MPM | 2.4.58, prefork |
| mod_perl | 2.0.13 |
| OpenTelemetry Perl (API, SDK, OTLP exporter) | 0.036, 0.028, 0.021: the same releases as the reference implementation |
| DBD::MariaDB | 1.24 |
| Database | MariaDB with TLS required (require_secure_transport = ON) and a read-only application user |
| Node.js | 22, with the pinned packages in Section 15.11 |
| Grafana Alloy | 1.20.1 |
| Grafana Tempo | 2.10.5 |
Everything ran on one host without containers. Two deviations follow from that, and neither touches the code under test. Tempo listened on ports 14317 and 14318 so that Alloy could keep 4317 and 4318. One SDK dependency, Feature::Compat::Defer, could not be fetched and was reproduced from its documented behaviour: on Perl 5.36 and later it only enables Perl’s built-in defer feature.
13.2 Finding 1: PassEnv hides the environment from start-up code
Section 4.2 sets out the behaviour. Its effect showed up twice. The application read PRICING_URL when its module loaded, in the parent, saw nothing, and silently kept its default for the life of the server. And an SDK initialised in child-init exported to its default endpoint. In the Docker reference implementation both defaults happened to equal the real container names, so neither defect was visible there.
Fix. Use PerlPassEnv for every variable, and read application settings such as PRICING_URL when a request needs them, not when the module loads.
13.3 Finding 2: the child-init hook inside <VirtualHost> never ran
The reference configuration placed PerlChildInitHandler inside <VirtualHost>. In that position it did not run. This also explains why its log line was never seen in the reference implementation. The SDK was in fact initialised on each worker’s first request, by a fallback call at the top of the handler, which is where the PassEnv variables happen to be visible.
Fix. Register the hook at server level, and keep the fallback call as the first line of the handler. It must come first: until the SDK is initialised, the W3C propagator is the API’s no-op default, and an extract() before initialisation silently starts a new trace instead of continuing the caller’s.
13.4 Finding 3: the stock batch processor is the wrong tool for prefork
The SDK’s batch processor was tested three ways inside Apache:
| Test | Configuration | Result |
|---|---|---|
| B2 | Batch processor, initialised on first request, force_flush per request | Spans exported; about 0.2 s per request; one extra forked process per worker |
| B3 | Batch processor, initialised in child-init with PassEnv | No spans; requests blocked 12 to 17 s |
| B4 | Request processor (below), initialised in child-init with PassEnv | No spans, no error |
The batch processor hands each export to an IO::Async worker process, forked from the Apache worker: one more process for every Apache worker. The exporter retries failed requests up to five times with exponential back-off. In B3 the exporter had the wrong endpoint (Finding 1), so each request waited through the retries before giving up. B4 failed for the same reason, silently.
The final design replaces the batch processor with a small per-request processor: spans are held in memory for the duration of a request and sent in one synchronous call when the request ends. It starts no event loop, forks no process and never retries inside a request. It reuses the SDK’s own processor interface, OTLP exporter and propagators. Section 15.9 lists it in full.
13.5 What this implies for the original implementation
The original environment was not re-tested, so its exact cause is not confirmed. The findings above do, however, rank the likely explanations for any mod_perl deployment showing the same symptom:
| Candidate cause | Supporting evidence | How to check |
|---|---|---|
No flush, or flushing with shutdown | No flush: reproduced in test 4. shutdown: exports nothing and reports success (Section 11.3) | Inspect the request-level flush code |
| SDK initialised in the parent, before fork | mod_perl runs startup code in the parent, twice (Section 4.1) | Move initialisation into the worker |
| OpenTelemetry environment invisible to start-up code | Reproduced here with PassEnv (Section 4.2) | Log %ENV from the initialisation code |
| HTTP payload sent to the gRPC port | Silent at the default log level | Check endpoint and protocol together |
| Collector-to-backend path failing independently | Not investigated | Add a debug exporter to the Collector |
| Exporter version with old JSON defects | Unlikely: all documented fixes predate 0.021 | Check installed versions |
13.6 Finding 4: without an explicit timeout, one bad receiver hangs every request
With the receiver address made unreachable, every request hung for more than 30 seconds (Test G2). Under real traffic that would occupy every Apache worker in turn and take the site down.
The OTLP exporter applies the timeout passed to each export() call to its HTTP client. If a call passes none, the client’s timeout is cleared and a connection attempt can block indefinitely. The SDK’s batch processor always passes 30 seconds; a processor written without that detail passes nothing.
Fix. The per-request processor always passes an explicit timeout, 2 seconds by default, and the exporter is created with retries disabled. With the receiver unreachable, every request completed in 2.03 to 2.06 seconds, each worker logged the failure once, and the application kept serving.
13.7 Finding 5: a 40 ms stall on every export
Tracing initially added about 48 ms to every request (Test H). Timing the export alone showed the first export on a new connection taking 4 ms and every later one 42 to 47 ms.
That is the signature of Nagle’s algorithm meeting the receiver’s delayed acknowledgement. HTTP::Tiny keeps the connection alive and writes the request headers and body as separate packets, and the second waits for an acknowledgement the receiver deliberately delays.
Fix. Set TCP_NODELAY on HTTP::Tiny’s sockets. Export time fell from 43 ms to a median of 1.2 ms, and the overhead of tracing fell from about 48 ms to about 5 ms per request.
13.8 The design decisions, summarised
| Decision | Why | Evidence |
|---|---|---|
PerlPassEnv, never PassEnv | Start-up and child-init code must see the configuration | Section 4.2 |
| Child-init hook at server level | Inside <VirtualHost> it does not run | Section 13.3 |
| Initialisation guarded by a NO-OP fallback | The SDK dies on configuration errors | Test F |
| Handler calls initialisation first | extract() before initialisation loses the caller’s trace | Section 13.3 |
| Per-request processor instead of the batch processor | No timer, no forked worker, no retries inside a request | Sections 12.3, 13.4 |
| Explicit export timeout, retries disabled | Bounds the cost of a bad receiver | Test G2 |
TCP_NODELAY on the exporter’s connections | Removes a 40 ms stall per request | Test H |
| Failure and recovery logged once per worker | Silent span loss is unacceptable; per-request logging would flood the log | Test G1 |
| Generic error body to clients; full error on the span | Diagnostic detail for operators without leaking it to callers | Test C |
14. Final Architecture and Trace Lifecycle
The final pipeline has the same shape as the original: application, OpenTelemetry Collector distribution, trace store, user interface. The difference that mattered sits inside the first box.
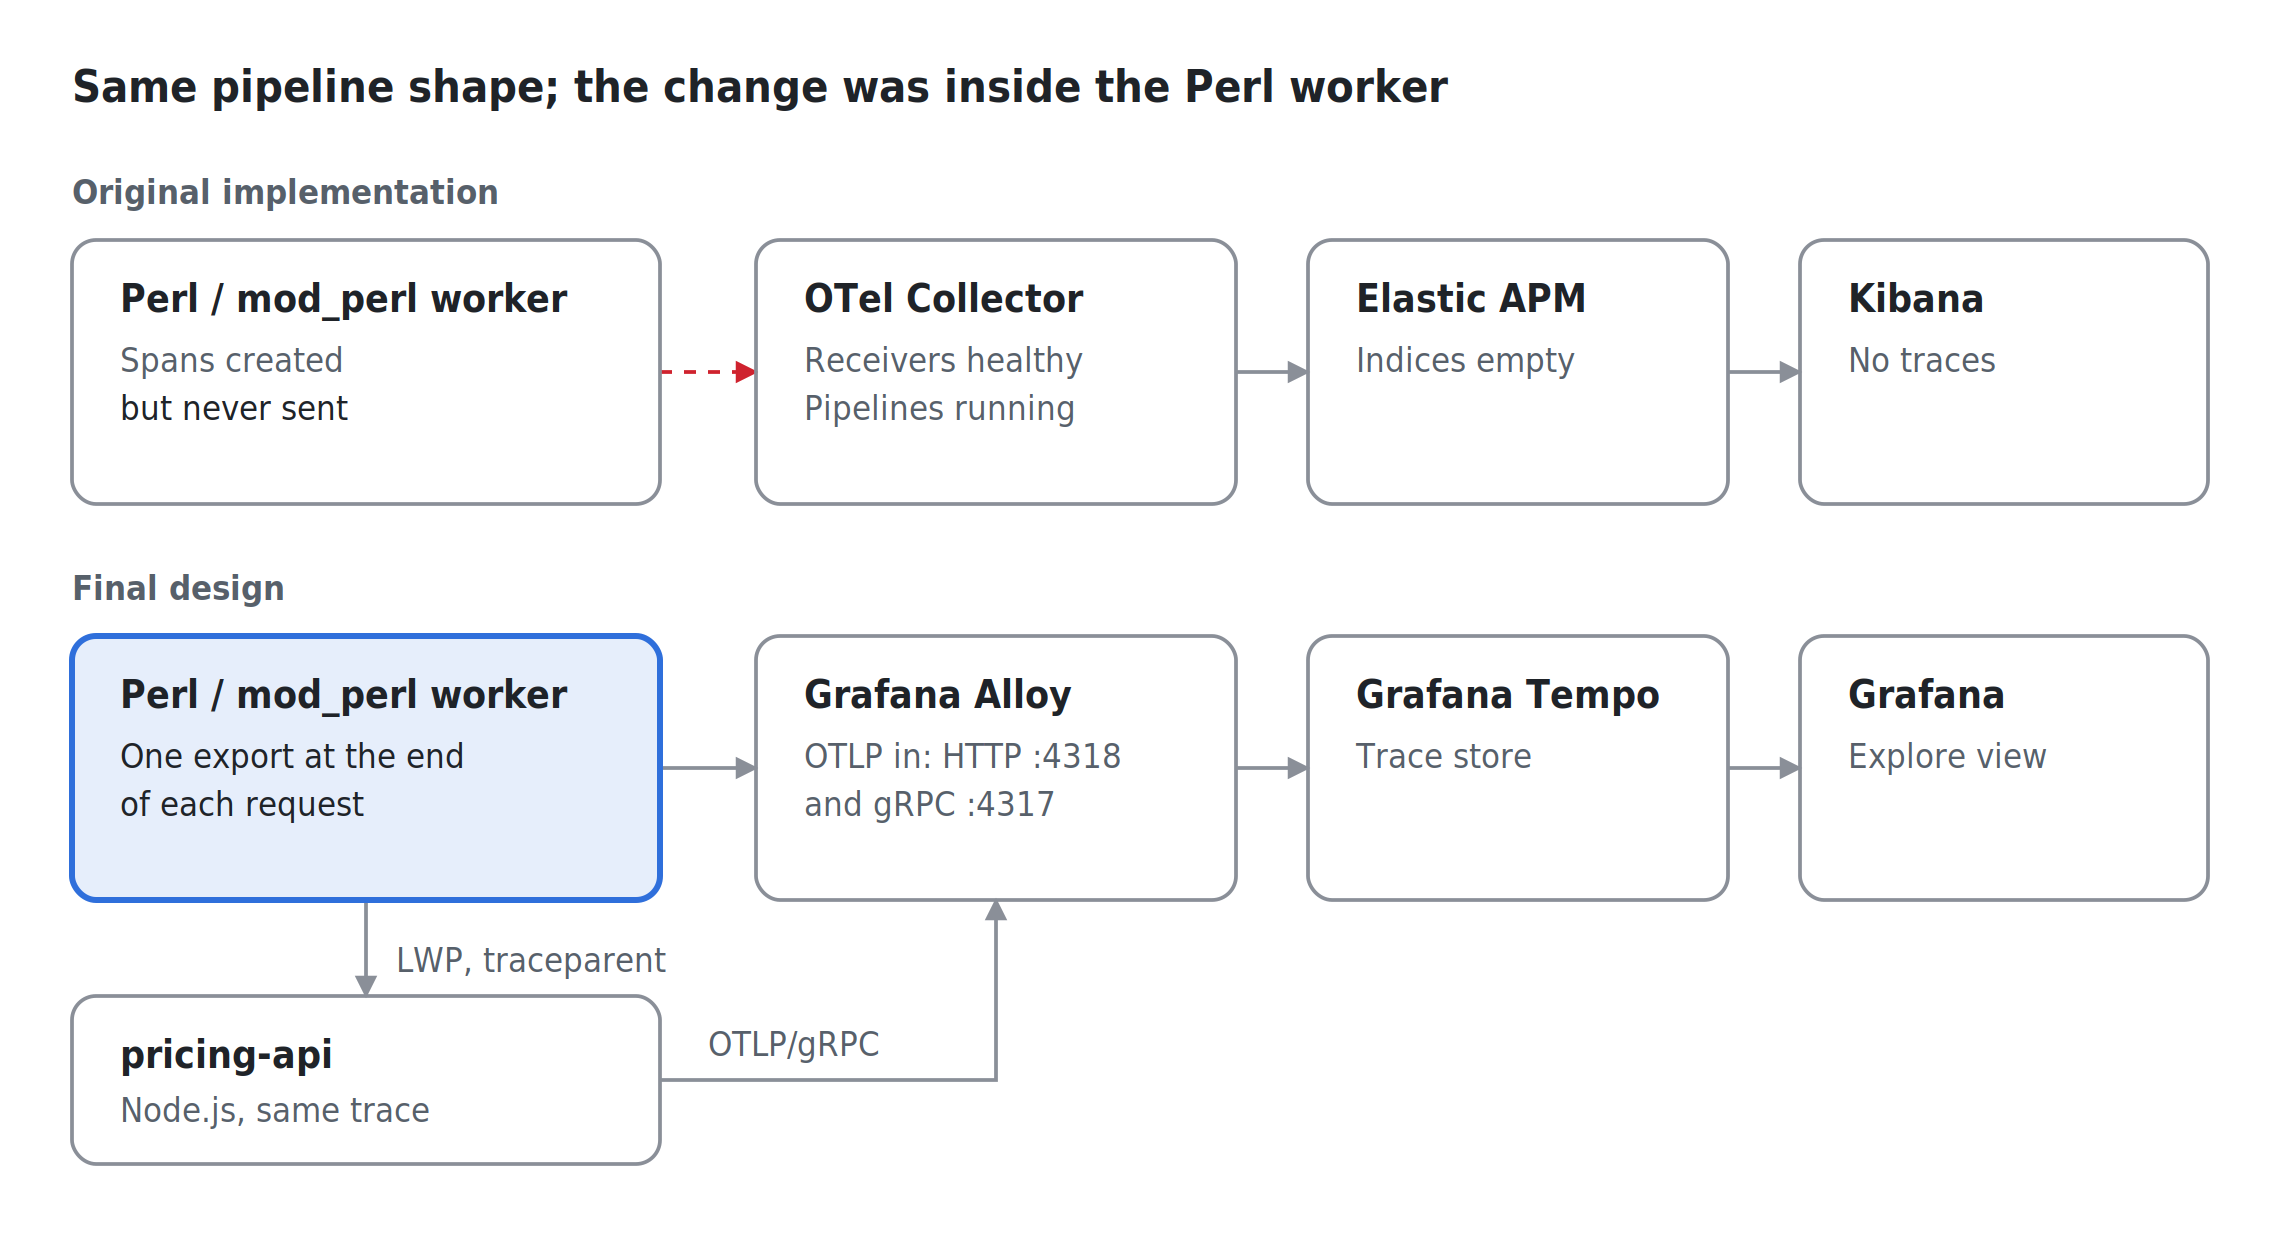
The dashed red line marks where the original pipeline failed: spans were created but never left the worker. Grafana Alloy occupies the same position as the OpenTelemetry Collector and uses the same upstream OTLP receiver (Section 12.2).
14.1 Lifecycle of one worker and one request
- Apache starts, loads
startup.plin the parent (modules only, no SDK state) and forks its workers. - In each worker, the server-level
PerlChildInitHandlerinitialises the SDK: tracer provider, W3C propagators, the per-request processor with its OTLP exporter, and DBI and LWP instrumentation. A failure here disables tracing in that worker and logs one line. - A client sends an HTTP request, optionally carrying a W3C
traceparentheader. - The handler confirms initialisation, copies the inbound headers into a lowercase map and extracts the upstream context.
- It creates a SERVER span parented on that context, and activates it with
dynamically. - DBI runs the query. The DBI instrumentation records
connectand the SQL statement as CLIENT spans under the server span. - The handler creates and activates a manual INTERNAL span,
pricing.lookup. - The LWP call records a CLIENT span and injects
traceparentinto the outbound request. pricing-apiextracts that context, records its own spans and exports them over OTLP/gRPC to Alloy on port 4317.- The Perl handler ends its server span and writes the response. The spans of this request are now held by the per-request processor.
- The handler flushes. The processor sends the request’s spans in one OTLP/HTTP call with JSON encoding to Alloy on port 4318, bounded by the export timeout.
- Alloy batches both streams and forwards them over OTLP/gRPC to Tempo. Grafana queries Tempo and renders the trace.
14.2 Structure of the resulting trace
One request to /order-detail produced this span tree in the second environment. Every parent ID in the stored trace matches; the raw output is in Section 16.2.
| Span | Service | Kind | Parent | Created by |
|---|---|---|---|---|
GET /order-detail | order-api | SERVER | The upstream caller named in traceparent | Manual |
↳ connect | order-api | CLIENT | GET /order-detail | DBI instrumentation |
↳ the SQL SELECT statement | order-api | CLIENT | GET /order-detail | DBI instrumentation |
↳ pricing.lookup | order-api | INTERNAL | GET /order-detail | Manual |
↳↳ GET | order-api | CLIENT | pricing.lookup | LWP instrumentation |
↳↳↳ GET /price | pricing-api | SERVER | The LWP GET span | Node.js HTTP instrumentation |
| ↳↳↳↳ Express middleware and handler spans | pricing-api | INTERNAL | GET /price | Express instrumentation |
The DBI instrumentation names its statement span after the SQL text itself. That helps diagnosis, but any literal value interpolated into SQL ends up in the trace, so use bound parameters.
15. Implementation Guide
This section is the complete implementation of the final design. Every listing is the exact file that passed the tests in Section 16; nothing has been retyped or simplified. Each file is followed by an explanation of what each part does and why it is there.
15.1 Project layout
tracing-demo/
├── .env.example            database connection for order-api
├── docker-compose.yml      order-api and pricing-api containers
├── db/
│   └── schema.sql          demo schema, seed data, read-only user
├── tempo/
│   └── tempo.yaml          trace store
├── alloy/
│   └── config.alloy        OTLP receiver -> batch -> Tempo
├── perl/
│   ├── Dockerfile
│   ├── certs/db-ca.pem     CA bundle for the database's TLS certificate
│   ├── conf/order-api.conf Apache + mod_perl configuration
│   └── app/
│       ├── startup.pl      loaded once in the Apache parent
│       └── OrderApp/
│           ├── Otel.pm     SDK initialisation, tracer, flush
│           ├── Otel/RequestProcessor.pm   per-request span processor
│           └── Order.pm    the instrumented response handler
├── pricing/
│   ├── Dockerfile
│   ├── package.json  package-lock.json
│   ├── tracing.js          OpenTelemetry bootstrap
│   └── server.js           GET /price
└── tools/
    ├── smoke-span.sh       proves the receiver path
    └── spans.py            lists the spans of one trace
15.2 Prerequisites
| Requirement | Notes |
|---|---|
| Perl 5.32 or later with mod_perl 2, Apache prefork MPM | Debian 11 packages in the Dockerfile. The reference implementation ran Perl 5.32.1; the final design was verified on Perl 5.38.2 |
| OpenTelemetry Perl API 0.036, SDK 0.028, OTLP exporter 0.021 | Pinned in the Dockerfile |
Syntax::Keyword::Dynamically | Needed for context activation; install it explicitly |
DBD::MariaDB and LWP::UserAgent | The libraries instrumented automatically in this design |
| A MySQL-compatible database | TLS was required in both test environments |
| An OTLP receiver and a trace store | Grafana Alloy and Tempo here; Section 12.2 explains why the receiver choice is not critical |
| Docker with Compose | For the container packaging in Sections 15.6 and 15.12 |
15.3 The trace backend
Create a shared network, then start Tempo and Alloy on it.
docker network create --driver bridge tracing-net

docker run -d --name tempo --network tracing-net --restart unless-stopped \
  -v $PWD/tempo/tempo.yaml:/etc/tempo.yaml:ro \
  -v $PWD/data/tempo:/var/tempo \
  grafana/tempo:2.10.5 -config.file=/etc/tempo.yaml

docker run -d --name alloy --network tracing-net --restart unless-stopped \
  -v $PWD/alloy/config.alloy:/etc/alloy/config.alloy:ro \
  grafana/alloy:v1.20.1 run /etc/alloy/config.alloy \
    --server.http.listen-addr=0.0.0.0:12345
Tempo runs as UID 10001, so its data directory must be owned by that UID. curl localhost:3200/ready returns ready about 15 seconds after start.
tempo/tempo.yaml
stream_over_http_enabled: true

server:
  http_listen_port: 3200
  grpc_listen_port: 9095
  log_level: info

distributor:
  receivers:
    otlp:
      protocols:
        grpc:
          endpoint: 0.0.0.0:4317
        http:
          endpoint: 0.0.0.0:4318

ingester:
  max_block_duration: 30m
  complete_block_timeout: 15m

compactor:
  compaction:
    block_retention: 168h
    compacted_block_retention: 1h
    compaction_window: 1h

storage:
  trace:
    backend: local
    blocklist_poll: 5m
    wal:
      path: /var/tempo/wal
    local:
      path: /var/tempo/blocks
    pool:
      max_workers: 50
      queue_depth: 2000
Tempo accepts OTLP itself, but here only Alloy sends to it. Blocks are kept for seven days (block_retention: 168h) on local disk.
alloy/config.alloy
logging {
  level  = "info"
  format = "logfmt"
}

otelcol.receiver.otlp "default" {
  grpc { endpoint = "0.0.0.0:4317" }
  http { endpoint = "0.0.0.0:4318" }

  output {
    traces = [otelcol.processor.batch.default.input]
  }
}

otelcol.processor.batch "default" {
  timeout             = "2s"
  send_batch_size     = 512
  send_batch_max_size = 1024

  output {
    traces = [otelcol.exporter.otlp.tempo.input]
  }
}

otelcol.exporter.otlp "tempo" {
  client {
    endpoint = "tempo:4317"
    tls { insecure = true }
  }
}
The pipeline has three components: a receiver that accepts OTLP over gRPC (port 4317) and HTTP (port 4318), a batch processor, and an exporter that forwards to Tempo. Nothing in it is specific to Perl. A retry_on_failure block placed inside client is rejected with unrecognized block name; it is a sibling of client, and retry is on by default.
Single-host note. In the second test environment, without containers, Tempo listened on 14317 and 14318 and Alloy’s exporter pointed at 127.0.0.1:14317. Those port numbers are the only difference from the files above.
15.4 Prove the pipeline before writing any Perl
If a hand-built span cannot be posted and read back, no change to the application will help.
tools/smoke-span.sh
#!/bin/bash
# Prove the receiver path: post one synthetic OTLP/JSON span, read it back.
# Usage: smoke-span.sh [otlp-http-base] [tempo-base]
OTLP=${1:-http://localhost:4318}; TEMPO=${2:-http://localhost:3200}
NOW=$(date +%s)000000000; END=$(( $(date +%s) + 1 ))000000000
TRACE_ID=$(openssl rand -hex 16); SPAN_ID=$(openssl rand -hex 8)
cat > /tmp/span.json <
Expect HTTP 200 with {"partialSuccess":{}}, then JSON containing the span. Run it from a container on tracing-net with http://alloy:4318 and http://tempo:3200, or from the host if those ports are published.
15.5 The database
db/schema.sql
-- orders_demo: minimal schema for the reference implementation
CREATE DATABASE IF NOT EXISTS orders_demo
  CHARACTER SET utf8mb4 COLLATE utf8mb4_unicode_ci;
USE orders_demo;

CREATE TABLE IF NOT EXISTS products (
  id          INT UNSIGNED  NOT NULL AUTO_INCREMENT PRIMARY KEY,
  sku         VARCHAR(32)   NOT NULL UNIQUE,
  name        VARCHAR(120)  NOT NULL,
  unit_price  DECIMAL(10,2) NOT NULL
) ENGINE=InnoDB;

CREATE TABLE IF NOT EXISTS orders (
  id          INT UNSIGNED  NOT NULL AUTO_INCREMENT PRIMARY KEY,
  product_id  INT UNSIGNED  NOT NULL,
  buyer_name  VARCHAR(120)  NOT NULL,
  quantity    INT UNSIGNED  NOT NULL,
  status      VARCHAR(20)   NOT NULL DEFAULT 'NEW',
  created_at  TIMESTAMP     NOT NULL DEFAULT CURRENT_TIMESTAMP,
  CONSTRAINT fk_orders_product FOREIGN KEY (product_id) REFERENCES products (id)
) ENGINE=InnoDB;

-- Explicit ids + INSERT IGNORE keep the script safe to re-run
INSERT IGNORE INTO products (id, sku, name, unit_price) VALUES
  (1, 'SKU-1001', 'Industrial bearing',  450.00),
  (2, 'SKU-1002', 'Hydraulic valve',    1280.00),
  (3, 'SKU-1003', 'Copper cable, 10 m',  760.00);

INSERT IGNORE INTO orders (id, product_id, buyer_name, quantity, status) VALUES
  (1, 1, 'Acme Fabrication', 20, 'NEW'),
  (2, 2, 'Northwind Tools',   4, 'SHIPPED'),
  (3, 3, 'Contoso Works',    12, 'NEW');

-- Read-only application account, TLS required
CREATE USER IF NOT EXISTS 'app_user'@'%' IDENTIFIED BY 'change-me' REQUIRE SSL;
GRANT SELECT ON orders_demo.* TO 'app_user'@'%';| Part | Why |
|---|---|
Explicit IDs and INSERT IGNORE | The script can be run again safely; a partial first run caused duplicate-key errors before this was added |
app_user ... REQUIRE SSL | The server refuses an unencrypted login for this account |
GRANT SELECT only | The application never writes, so the account cannot either |
SKU-1001 to SKU-1003 | Must match the prices in pricing/server.js |
Put the CA bundle that signed the database’s certificate in perl/certs/db-ca.pem. For a managed database this is the provider’s published bundle. The handler’s DSN refers to it.
15.6 The Perl image
perl/Dockerfile
FROM debian:bullseye

ENV DEBIAN_FRONTEND=noninteractive

# Debian 11 ships Perl 5.32 and a mod_perl built against that same Perl
RUN apt-get update && apt-get install -y --no-install-recommends \
      apache2 libapache2-mod-perl2 \
      perl cpanminus build-essential \
      libssl-dev zlib1g-dev \
      libdbi-perl libdbd-mariadb-perl \
      libwww-perl liblwp-protocol-https-perl \
      libjson-xs-perl ca-certificates curl \
    && rm -rf /var/lib/apt/lists/*

# Pin the OpenTelemetry releases this article was verified against
RUN cpanm --notest --quiet \
      OpenTelemetry@0.036 \
      OpenTelemetry::SDK@0.028 \
      OpenTelemetry::Exporter::OTLP@0.021 \
      Syntax::Keyword::Dynamically \
    && rm -rf /root/.cpanm

RUN a2dismod mpm_event mpm_worker 2>/dev/null; a2enmod mpm_prefork perl headers

COPY conf/order-api.conf /etc/apache2/sites-available/000-default.conf
COPY app /opt/orderapp
COPY certs/db-ca.pem /opt/orderapp/db-ca.pem
RUN chmod -R a+rX /opt/orderapp

EXPOSE 8095
CMD ["apache2ctl", "-D", "FOREGROUND"]| Part | Why |
|---|---|
debian:bullseye | Perl 5.32 and a mod_perl built against that same Perl, from one package set |
libdbd-mariadb-perl, libwww-perl | The DBI driver and HTTP client that the instrumentation hooks |
cpanm ... @0.036, @0.028, @0.021 | Pins the exact OpenTelemetry releases verified here; the SDK is pre-1.0 and its API can change |
Syntax::Keyword::Dynamically | Required for dynamically otel_current_context = ... |
a2enmod mpm_prefork perl | Prefork is the process model this design targets |
Verification note. The application code and Apache configuration in this section were verified in both test environments. This Dockerfile is the reference implementation’s packaging, updated with version pins; the second environment installed the same packages natively.
15.7 Apache configuration
perl/conf/order-api.conf
# Pass container environment to Perl with mod_perl's PerlPassEnv, one
# directive per variable and never with backslash continuations.
# Apache's own PassEnv is NOT enough: its values reach %ENV only during
# a request, so code running at startup or in PerlChildInitHandler would
# silently see nothing and fall back to defaults.
PerlPassEnv DB_HOST
PerlPassEnv DB_PORT
PerlPassEnv DB_USER
PerlPassEnv DB_PASSWORD
PerlPassEnv APP_DB_NAME
PerlPassEnv PRICING_URL
PerlPassEnv OTEL_SERVICE_NAME
PerlPassEnv OTEL_EXPORTER_OTLP_ENDPOINT
PerlPassEnv OTEL_EXPORTER_OTLP_PROTOCOL
PerlPassEnv OTEL_RESOURCE_ATTRIBUTES
PerlPassEnv OTEL_PERL_INTERNAL_LOG_LEVEL
PerlPassEnv ORDERAPP_OTEL_EXPORT_TIMEOUT
ServerName order-api

Listen 8095

# Perl setup at SERVER level. startup.pl only loads modules (parent).
# The SDK is initialised in each worker after fork, by the child-init
# hook. Inside  this hook does not run.
PerlSwitches -I/opt/orderapp
PerlRequire /opt/orderapp/startup.pl
PerlChildInitHandler OrderApp::Otel::init


    ServerName order-api
    DocumentRoot /opt/orderapp


        Options -Indexes
        AllowOverride None
        Require all granted


        SetHandler perl-script
        PerlResponseHandler OrderApp::Order
        Require all granted


    ErrorLog /dev/stderr
    CustomLog /dev/stdout combined
    LogLevel info
| Directive | Why |
|---|---|
PerlPassEnv, one per variable | Makes each variable visible in %ENV at start-up, in child-init and in requests. PassEnv is visible only in requests (Section 4.2). A backslash continuation joins lines into one broken directive |
PerlSwitches, PerlRequire at server level | Loads the application once, in the parent, before workers fork |
PerlChildInitHandler OrderApp::Otel::init at server level | Initialises the SDK in each worker after fork. Inside <VirtualHost> it does not run (Section 4.3) |
<Directory /opt/orderapp> with Require all granted | Debian denies access outside /var/www by default; without it every route returns 403 |
<LocationMatch> with PerlResponseHandler | Routes the four endpoints to the handler |
ErrorLog /dev/stderr | Request-time logs go to the container log. Messages from child-init and the SDK go to Apache’s main error log |
15.8 OrderApp::Otel: initialisation, tracer and flush
perl/app/OrderApp/Otel.pm
package OrderApp::Otel;
use strict;
use warnings;

use OpenTelemetry;    # API only: safe to load in the parent

our $INITIALISED = 0; # initialisation attempted in this process
our $ENABLED     = 0; # SDK loaded successfully in this process
our $TRACER;


# Initialise the SDK once per Apache worker. Registered as the
# PerlChildInitHandler, so it runs in each worker right after fork();
# the handler also calls it as a safety net. Never call it from
# startup.pl: that runs in the parent, whose state every worker
# inherits through fork(). Needs PerlPassEnv (not PassEnv) for the
# OTEL_* variables to be visible here.
sub init {
    return if $INITIALISED;
    $INITIALISED = 1;    # one attempt per process, even if it fails

    $ENV{OTEL_SERVICE_NAME}           ||= 'order-api';
    $ENV{OTEL_EXPORTER_OTLP_ENDPOINT} ||= 'http://alloy:4318';
    $ENV{OTEL_EXPORTER_OTLP_PROTOCOL} ||= 'http/json';

    # Upper bound, in seconds, on the time one request can spend
    # exporting its spans. Read here, not at module load, so that the
    # value passed with PerlPassEnv is visible.
    my $export_timeout = $ENV{ORDERAPP_OTEL_EXPORT_TIMEOUT} || 2;

    # SDK 0.025+ dies on configuration errors, for example an
    # unsupported OTLP protocol. Contain it: a telemetry fault must
    # never take a worker down.
    $ENABLED = eval {
        # 'none' makes the SDK install the tracer provider and the W3C
        # propagators but not its batch processor; our own processor
        # exports each request's spans at the end of that request.
        local $ENV{OTEL_TRACES_EXPORTER} = 'none';
        require OpenTelemetry::SDK;
        OpenTelemetry::SDK->import;

        _enable_tcp_nodelay();
        require OpenTelemetry::Exporter::OTLP;
        require OrderApp::Otel::RequestProcessor;
        OpenTelemetry->tracer_provider->add_span_processor(
            OrderApp::Otel::RequestProcessor->new(
                exporter => OpenTelemetry::Exporter::OTLP->new(
                    retries => 0,     # never sleep and retry inside a request
                ),
                export_timeout => $export_timeout,   # seconds, per export
            ),
        );

        require OpenTelemetry::Instrumentation;
        OpenTelemetry::Instrumentation->import(qw(DBI LWP::UserAgent));
        1;
    } ? 1 : 0;

    if ($ENABLED) {
        warn "[otel] SDK initialised in worker pid $$\n";
    }
    else {
        my $err = $@ || 'unknown error';
        warn "[otel] SDK initialisation failed in worker pid $$; tracing disabled: $err";
    }

    # A real tracer if the SDK loaded, the API's no-op tracer otherwise.
    # Application code calls it the same way in both cases.
    $TRACER = OpenTelemetry->tracer_provider->tracer(
        name    => 'order-api-perl',
        version => '1.0.0',
    );
    return;
}

# The OTLP exporter sends with HTTP::Tiny over a kept-alive connection,
# writing headers and body separately. Without TCP_NODELAY, Nagle's
# algorithm and the receiver's delayed ACK stall every export after the
# first by about 40 ms (measured: 43 ms -> 1.2 ms median). This sets
# TCP_NODELAY on HTTP::Tiny sockets opened in this worker process.
sub _enable_tcp_nodelay {
    require HTTP::Tiny;
    require Socket;
    no warnings 'redefine';
    my $connect = \&HTTP::Tiny::Handle::connect;
    *HTTP::Tiny::Handle::connect = sub {
        my $handle = $connect->(@_);
        setsockopt( $handle->{fh}, Socket::IPPROTO_TCP(), Socket::TCP_NODELAY(), 1 )
            if $handle && $handle->{fh};
        return $handle;
    };
    return;
}

sub tracer {
    init() unless $INITIALISED;
    return $TRACER;
}

# Call once per request, after the response has been written: the
# request processor exports only when flushed.
sub flush {
    return unless $ENABLED;
    my $provider = OpenTelemetry->tracer_provider;
    return unless $provider->can('force_flush');
    eval { $provider->force_flush->get; 1 }
        or warn "[otel] force_flush failed: $@";
    return;
}

1;
use OpenTelemetry; loads the API only. The API is safe in the parent: without an SDK it hands out no-op tracers.
init is the PerlChildInitHandler. $INITIALISED is set before anything else, so a failed initialisation is attempted once per worker rather than on every request.
The defaults (||=) apply only when a variable is absent. They are a safety net, not configuration: in the reference implementation they silently masked the PassEnv defect.
$export_timeout is read inside init, not at module load, because module-load code runs in the parent before the configuration is visible.
The eval block is the NO-OP guarantee. The SDK dies on configuration errors (Section 4.4). If anything in the block fails, $ENABLED stays false, one line is logged, and the worker continues with the API’s no-op tracer. Test F confirms the application keeps serving.
local $ENV{OTEL_TRACES_EXPORTER} = 'none' makes the SDK install its tracer provider and W3C propagators without its batch processor, which is replaced by the per-request processor (Section 13.4).
retries => 0 stops the exporter sleeping and retrying inside a request. export_timeout bounds each export (Section 13.6).
OpenTelemetry::Instrumentation->import(qw(DBI LWP::UserAgent)) installs the automatic database and HTTP client spans.
_enable_tcp_nodelay wraps HTTP::Tiny’s connect so that every socket it opens has TCP_NODELAY set, removing the 40 ms stall (Section 13.7). It affects HTTP::Tiny connections in that worker process only, which is safe: TCP_NODELAY changes packet timing, not behaviour.
tracer returns the worker’s tracer, initialising first if needed.
flush exports the current request’s spans. It does nothing when tracing is disabled, and it checks for force_flush because the API’s no-op provider does not have one.
15.9 OrderApp::Otel::RequestProcessor: one export per request
perl/app/OrderApp/Otel/RequestProcessor.pm
use Object::Pad ':experimental(init_expr)';

package OrderApp::Otel::RequestProcessor;

# A span processor for Apache prefork workers. It keeps the spans of the
# current request in memory and exports them in ONE synchronous OTLP call
# when force_flush() is called at the end of the request.
#
# Unlike the SDK's batch processor it starts no background loop and forks
# no export worker, so nothing runs between requests and nothing extra
# survives inside the Apache process tree.
class OrderApp::Otel::RequestProcessor
    :does(OpenTelemetry::Trace::Span::Processor)
{
    use Feature::Compat::Try;
    use Future::AsyncAwait;
    use OpenTelemetry;
    use OpenTelemetry::Constants -trace_export;

    field $exporter  :param;
    field $max_spans :param //= 1000;   # cap for a runaway request
    field $export_timeout :param //= 2; # seconds; ALWAYS passed to export()
    field @buffer;
    field $dropped = 0;
    field $failing = 0;   # consecutive failed exports in this worker

    # Required by the processor role: queue finished span snapshots
    method process ( @items ) {
        for my $item (@items) {
            if ( @buffer >= $max_spans ) { $dropped++; next }
            push @buffer, $item;
        }
        return;
    }

    method on_start ( $span, $context ) { }

    method on_end ($span) {
        try {
            return unless $span->context->trace_flags->sampled;
            $self->process( $span->snapshot );
        }
        catch ($e) {
            OpenTelemetry->handle_error(
                exception => $e,
                message   => 'unexpected error in ' . __PACKAGE__ . '->on_end',
            );
        }
    }

    async method force_flush ( $timeout = undef ) {
        if ($dropped) {
            warn "[otel] dropped $dropped spans over the per-request cap of $max_spans\n";
            $dropped = 0;
        }
        return TRACE_EXPORT_SUCCESS unless @buffer;
        my @batch  = splice @buffer;  # empty the buffer before exporting
        # Pass the timeout explicitly. The OTLP exporter applies the
        # timeout given to each export() call to its HTTP client, and a
        # missing value disables the timeout altogether: one unreachable
        # receiver would then hang every request indefinitely.
        my $result = $exporter->export( \@batch, $timeout // $export_timeout )
            // TRACE_EXPORT_FAILURE;

        # Log the first failure and the recovery, not every request, so
        # a receiver outage cannot flood the Apache error log.
        if ( $result != TRACE_EXPORT_SUCCESS ) {
            warn "[otel] span export failed in pid $$; spans dropped until the receiver recovers\n"
                unless $failing++;
        }
        elsif ($failing) {
            warn "[otel] span export recovered in pid $$ after $failing failed requests\n";
            $failing = 0;
        }
        return $result;
    }

    async method shutdown ( $timeout = undef ) {
        await $self->force_flush($timeout);
        await $exporter->shutdown($timeout);
    }
}

1;
:does(OpenTelemetry::Trace::Span::Processor) implements the SDK’s processor interface, the same way the SDK’s own Simple and Batch processors do, so it plugs into the standard tracer provider.
on_end receives each finished span. Only sampled spans are kept, and a snapshot is taken, as the SDK’s processors do.
process is required by the interface. It appends to the buffer, with a cap of 1,000 spans so that a runaway request cannot exhaust memory. Dropped spans are counted and reported at the next flush.
force_flush empties the buffer before exporting, so a failed export can never leave spans to leak into the next request. It always passes a timeout to export(); without one, the exporter’s HTTP client has no timeout at all (Section 13.6).
The failure log records the first failed export in a worker and the recovery, not every request. An outage therefore produces one line per worker instead of one per request. Test G1 shows both messages.
shutdown exports anything still buffered, then shuts the exporter down. Unlike the SDK’s batch processor (Section 11.3), it does not discard queued spans.
15.10 OrderApp::Order: the instrumented handler
perl/app/startup.pl, loaded once in the parent:
use strict;
use warnings;

# Runs in the Apache PARENT process, before workers are forked.
# Load modules only; never initialise the OpenTelemetry SDK here.
use lib '/opt/orderapp';
use DBI;
use LWP::UserAgent;
use JSON::XS;
use OrderApp::Otel;
use OrderApp::Order;

warn "[startup] parent pid $$ loaded modules (SDK deliberately NOT initialised)\n";
1;
It loads modules so that workers share their compiled code, and deliberately does nothing else. Its log line appears twice on every start, because Apache runs startup code twice (Section 4.1).
perl/app/OrderApp/Order.pm
package OrderApp::Order;
use strict;
use warnings;

use Apache2::RequestRec ();
use Apache2::RequestIO  ();
use Apache2::RequestUtil ();
use Apache2::Const -compile => qw(OK);
use APR::Table ();

use JSON::XS ();
use DBI;
use LWP::UserAgent;

use OrderApp::Otel;
use OpenTelemetry -all;
use OpenTelemetry::Constants -span_kind, -span_status;
use Syntax::Keyword::Dynamically;

my $JSON = JSON::XS->new->canonical->utf8;
our $DBH;          # cached per Apache child
our $UA;

sub _dbh {
    return $DBH if $DBH && eval { $DBH->ping };
    my $dsn = sprintf(
        'dbi:MariaDB:database=%s;host=%s;port=%s;mariadb_ssl=1;mariadb_ssl_ca_file=%s',
        $ENV{APP_DB_NAME} || 'orders_demo',
        $ENV{DB_HOST}, $ENV{DB_PORT} || 3306,
        '/opt/orderapp/db-ca.pem');
    $DBH = DBI->connect($dsn, $ENV{DB_USER}, $ENV{DB_PASSWORD},
        { RaiseError => 1, PrintError => 0, AutoCommit => 1 });
    return $DBH;
}

# Read per request rather than when the module loads, so the value
# always reflects the environment Apache passed in.
sub _pricing_url { $ENV{PRICING_URL} || 'http://pricing-api:8097' }

sub _ua {
    $UA ||= LWP::UserAgent->new(timeout => 8, agent => 'order-api/1.0');
    return $UA;
}

# Lowercase-keyed copy of inbound headers, so the W3C propagator finds
# 'traceparent' regardless of client casing.
sub _carrier {
    my $r = shift;
    my %h;
    $r->headers_in->do(sub { my ($k, $v) = @_; $h{ lc $k } = $v; 1 });
    return \%h;
}

sub _json_out {
    my ($r, $status, $data) = @_;
    $r->status($status);
    $r->content_type('application/json');
    $r->print($JSON->encode($data));
    return Apache2::Const::OK;
}

sub handler {
    my $r = shift;

    # Safety net, and it must come first. Normally child-init has already
    # run; if it has not, the W3C propagator is still the API's no-op
    # default and the extract() below would silently start a new trace.
    OrderApp::Otel::init() unless $OrderApp::Otel::INITIALISED;

    my $uri    = $r->uri;
    my $method = $r->method;

    # MANUAL: extract upstream W3C trace context
    my $parent_ctx = OpenTelemetry->propagator->extract(
        _carrier($r), undef, sub { $_[0]->{ lc $_[1] } });

    my $route = $uri;
    $route =~ s{/\d+$}{/:id};

    my $span = OrderApp::Otel::tracer()->create_span(
        name       => "$method $route",
        kind       => SPAN_KIND_SERVER,
        parent     => $parent_ctx,
        attributes => {
            'http.request.method' => $method,
            'http.route'          => $route,
            'url.path'            => $uri,
            'server.address'      => $r->hostname // 'order-api',
            'process.pid'         => $$,
        },
    );

    # Activate for this request so DBI and LWP spans nest underneath.
    dynamically otel_current_context = otel_context_with_span($span);

    my ($status, $body) = (200, {});
    my $ok = eval {
        if    ($uri eq '/health')        { $body = { status => 'ok', pid => $$ } }
        elsif ($uri eq '/orders')        { ($status, $body) = _orders() }
        elsif ($uri eq '/order-detail')  { ($status, $body) = _order_detail($r) }
        elsif ($uri eq '/test/db-error') { ($status, $body) = _db_error() }
        else                             { ($status, $body) = (404, { error => 'not found' }) }
        1;
    };

    if (!$ok) {
        my $err = $@ || 'unknown error';
        $err =~ s/\s+$//;
        $span->record_exception($err) if $span->can('record_exception');
        $span->set_status(SPAN_STATUS_ERROR, $err);
        $span->set_attribute('error.type' => 'exception');
        ($status, $body) = (500, { error => 'internal error' });
    }
    else {
        $span->set_status($status >= 500 ? SPAN_STATUS_ERROR : SPAN_STATUS_OK);
    }

    $span->set_attribute('http.response.status_code' => $status);
    $span->end;

    my $out = _json_out($r, $status, $body);

    # The batch span processor never exports on its own under mod_perl:
    # flush explicitly once the response has been written.
    OrderApp::Otel::flush();

    return $out;
}

sub _orders {
    my $rows = _dbh()->selectall_arrayref(
        'SELECT o.id, o.buyer_name, o.quantity, o.status, p.sku, p.name AS product
           FROM orders o JOIN products p ON p.id = o.product_id
          ORDER BY o.id LIMIT 25',
        { Slice => {} });
    return (200, { count => scalar(@$rows), orders => $rows });
}

# Deepest path: mod_perl -> MariaDB -> (LWP) Node.js pricing-api
sub _order_detail {
    my $r = shift;
    my %q = map { my ($k, $v) = split /=/, $_, 2; ($k => $v) }
            split /&/, ($r->args // '');
    my $id = $q{id} || 1;
    $id =~ s/\D//g;
    $id ||= 1;

    my $row = _dbh()->selectrow_hashref(
        'SELECT o.id, o.buyer_name, o.quantity, o.status,
                p.id AS product_id, p.sku, p.name AS product, p.unit_price
           FROM orders o JOIN products p ON p.id = o.product_id
          WHERE o.id = ?', undef, $id);
    return (404, { error => 'order not found', id => $id }) unless $row;

    # MANUAL business-logic span
    my $child = OrderApp::Otel::tracer()->create_span(
        name       => 'pricing.lookup',
        kind       => SPAN_KIND_INTERNAL,
        attributes => { 'app.order.id' => $id, 'app.product.sku' => $row->{sku} },
    );

    my $pricing;
    {
        dynamically otel_current_context = otel_context_with_span($child);
        my $res = _ua()->get(sprintf('%s/price?sku=%s&qty=%s',
            _pricing_url(), $row->{sku}, $row->{quantity}));
        if ($res->is_success) {
            $pricing = eval { $JSON->decode($res->decoded_content) };
        }
        else {
            $child->set_status(SPAN_STATUS_ERROR, $res->status_line);
        }
    }
    $child->end;

    $row->{pricing} = $pricing;
    return (200, $row);
}

# Controlled, non-destructive SQL failure: the column does not exist.
sub _db_error {
    my $rows = _dbh()->selectall_arrayref(
        'SELECT nonexistent_column FROM products LIMIT 1');
    return (200, { unexpected => 1 });
}

1;
_dbh caches one database handle per worker and reconnects if ping fails. The DSN enables TLS with mariadb_ssl=1 and verifies the server against the CA bundle. The first query in each worker therefore also produces a connect span.
_pricing_url reads its setting per request. Reading it into a variable at module load is what caused the silent default in Section 13.2.
_carrier copies the inbound headers into a lowercase hash, because the W3C propagator looks up traceparent in lower case and clients may send any casing.
The first line of handler calls init if child-init has not run. It must precede extract(); otherwise the propagator is still the no-op default and the caller’s trace is lost.
extract reads traceparent into a context. With no header, it returns an empty context and the server span becomes a new root.
create_span opens the SERVER span with stable HTTP attributes. $route replaces a trailing numeric ID with :id, keeping span names low-cardinality.
dynamically otel_current_context = ... makes the server span current for the rest of the handler and restores the previous context automatically when the handler returns. This is what makes the DBI and LWP spans its children.
The eval block routes the request. Any exception is recorded on the span with record_exception and SPAN_STATUS_ERROR, while the client receives a generic internal error. Operators get the detail and callers do not.
$span->end, then _json_out, then flush: the span is ended so that it reaches the processor, the response is written, and only then are the request’s spans exported.
_order_detail shows a manual business span. pricing.lookup is created as INTERNAL and made current inside a bare block with dynamically, so the LWP call becomes its child. When the block exits, the server span is current again. A failed pricing call marks the business span as an error without failing the request.
_db_error issues a read-only query against a column that does not exist, to produce a real database error on demand.
15.11 pricing-api: the Node.js service
pricing/package.json
{
  "name": "pricing-api",
  "version": "1.0.0",
  "private": true,
  "main": "server.js",
  "scripts": { "start": "node server.js" },
  "dependencies": {
    "express": "4.21.2",
    "@opentelemetry/sdk-node": "0.53.0",
    "@opentelemetry/auto-instrumentations-node": "0.52.0",
    "@opentelemetry/exporter-trace-otlp-grpc": "0.53.0"
  }
}
Exact versions are pinned. Commit package-lock.json alongside it; the Dockerfile installs with npm ci.
pricing/tracing.js
'use strict';
// Loaded before anything else (see server.js) so the instrumentations can
// patch http and express before those modules are first required.
const { NodeSDK } = require('@opentelemetry/sdk-node');
const { getNodeAutoInstrumentations } = require('@opentelemetry/auto-instrumentations-node');
const { OTLPTraceExporter } = require('@opentelemetry/exporter-trace-otlp-grpc');

const sdk = new NodeSDK({
  traceExporter: new OTLPTraceExporter({
    url: process.env.OTEL_EXPORTER_OTLP_ENDPOINT || 'http://alloy:4317'
  }),
  instrumentations: [getNodeAutoInstrumentations({
    '@opentelemetry/instrumentation-fs':  { enabled: false },
    '@opentelemetry/instrumentation-dns': { enabled: false },
    '@opentelemetry/instrumentation-net': { enabled: false },
    '@opentelemetry/instrumentation-http': {
      ignoreIncomingRequestHook: (req) => req.url === '/health'
    }
  })]
});
sdk.start();

// Flush buffered spans when the container stops.
for (const sig of ['SIGTERM', 'SIGINT']) {
  process.on(sig, () => sdk.shutdown().finally(() => process.exit(0)));
}
This is the whole of the Node.js instrumentation: the SDK, the auto-instrumentations and an OTLP/gRPC exporter. File-system, DNS and raw socket instrumentations are disabled to keep traces readable, and /health is not traced. On SIGTERM the SDK is shut down so buffered spans are sent before the container stops.
pricing/server.js
'use strict';
require('./tracing');                  // must be the first require

const express = require('express');
const app  = express();
const PORT = Number(process.env.PORT) || 8097;
const TAX_RATE = 0.18;

// Unit prices by SKU; matches the products table in db/schema.sql
const PRICES = { 'SKU-1001': 450.00, 'SKU-1002': 1280.00, 'SKU-1003': 760.00 };

app.get('/health', (req, res) => res.json({ status: 'ok' }));

app.get('/price', (req, res) => {
  const sku = String(req.query.sku || '');
  const qty = Math.max(1, parseInt(req.query.qty, 10) || 1);
  const unit = PRICES[sku];
  if (unit === undefined) {
    return res.status(404).json({ error: 'unknown sku', sku });
  }
  const subtotal = +(unit * qty).toFixed(2);
  const tax      = +(subtotal * TAX_RATE).toFixed(2);
  res.json({ sku, qty, unit_price: unit, subtotal, tax, total: +(subtotal + tax).toFixed(2) });
});

app.listen(PORT, () => console.log(`pricing-api listening on ${PORT}`));
require('./tracing') must be the first line, so the instrumentations can patch http and express before they load. The route itself contains no tracing code.
pricing/Dockerfile
FROM node:20-alpine
WORKDIR /app
COPY package.json package-lock.json ./
RUN npm ci --omit=dev
COPY tracing.js server.js ./
USER node
EXPOSE 8097
CMD ["node", "server.js"]
15.12 Containers and configuration
docker-compose.yml
services:

  order-api:
    build: ./perl
    image: perl-order-api:1.0.0
    container_name: order-api
    restart: unless-stopped
    networks: [tracing]
    mem_limit: 512m
    env_file: [.env]               # DB_HOST, DB_PORT, DB_USER, DB_PASSWORD only
    environment:
      APP_DB_NAME: orders_demo
      PRICING_URL: http://pricing-api:8097
      OTEL_SERVICE_NAME: order-api
      OTEL_EXPORTER_OTLP_ENDPOINT: http://alloy:4318
      OTEL_EXPORTER_OTLP_PROTOCOL: http/json
      OTEL_RESOURCE_ATTRIBUTES: service.version=1.0.0,deployment.environment=poc
      OTEL_PERL_INTERNAL_LOG_LEVEL: warning
    ports: ["8095:8095"]
    depends_on: [pricing-api]
    healthcheck:
      test: ["CMD", "curl", "-fsS", "http://127.0.0.1:8095/health"]
      interval: 20s
      timeout: 5s
      retries: 3
      start_period: 20s

  pricing-api:
    build: ./pricing
    image: pricing-api:1.0.0
    container_name: pricing-api
    restart: unless-stopped
    networks: [tracing]
    mem_limit: 320m
    security_opt: ["no-new-privileges:true"]
    environment:
      PORT: "8097"
      OTEL_SERVICE_NAME: pricing-api
      OTEL_EXPORTER_OTLP_ENDPOINT: http://alloy:4317
      OTEL_RESOURCE_ATTRIBUTES: service.version=1.0.0,deployment.environment=poc

networks:
  tracing:
    external: true
    name: tracing-net
.env.example
# Database connection for order-api. Keep OpenTelemetry settings out of
# this file; they belong in docker-compose.yml.
DB_HOST=db.example.internal
DB_PORT=3306
DB_USER=app_user
DB_PASSWORD=change-me
Keep OpenTelemetry settings out of .env. Compose’s environment: overrides env_file, but tools that read the file directly do not, and a stray endpoint there caused the port mismatch in Section 11.4.
15.13 Configuration reference
| Variable | Default in code | Purpose |
|---|---|---|
OTEL_SERVICE_NAME | order-api | Service identity in traces |
OTEL_EXPORTER_OTLP_ENDPOINT | http://alloy:4318 | The receiver’s OTLP/HTTP endpoint. Never port 4317 with an HTTP protocol |
OTEL_EXPORTER_OTLP_PROTOCOL | http/json | grpc is not supported by the Perl exporter and disables tracing (Test F) |
OTEL_RESOURCE_ATTRIBUTES | none | Resource metadata such as version and environment |
OTEL_PERL_INTERNAL_LOG_LEVEL | SDK default | trace when diagnosing; output goes to Apache’s main error log |
ORDERAPP_OTEL_EXPORT_TIMEOUT | 2 | Seconds one request may spend exporting. Test G3 confirmed a setting of 1 |
DB_HOST, DB_PORT, DB_USER, DB_PASSWORD, APP_DB_NAME | port 3306, orders_demo | Database connection |
PRICING_URL | http://pricing-api:8097 | Base URL of pricing-api |
Every variable must also have a PerlPassEnv line in the Apache configuration, or Perl will not see it.
15.14 Start and verify
docker compose up -d --build
sleep 25 && docker compose ps

TID=$(openssl rand -hex 16); SID=$(openssl rand -hex 8)
curl -s -H "traceparent: 00-$TID-$SID-01" "localhost:8095/order-detail?id=1"
echo "TRACE_ID=$TID  upstream span=$SID"
sleep 10
python3 tools/spans.py $TID
tools/spans.py
#!/usr/bin/env python3
"""List the spans of one trace from Tempo, with service, kind and parent."""
import base64, json, sys, time, urllib.request

TEMPO = 'http://localhost:3200'

def get(path):
    with urllib.request.urlopen(TEMPO + path, timeout=10) as r:
        return json.load(r)

def hexid(b64):
    return base64.b64decode(b64).hex() if b64 else ''

now = int(time.time())
window = 'start=%d&end=%d' % (now - 7200, now + 60)

if len(sys.argv) < 2:
    print(get('/api/search/tag/service.name/values?' + window).get('tagValues'))
    sys.exit(0)

trace = get('/api/traces/%s?%s' % (sys.argv[1], window))
for batch in trace['batches']:
    svc = next((a['value']['stringValue'] for a in batch['resource']['attributes']
                if a['key'] == 'service.name'), '?')
    for scope in batch['scopeSpans']:
        for sp in scope['spans']:
            print('%-12s %-20s %-10s span=%s parent=%s' % (
                svc, sp['name'][:20], sp.get('kind', '?').replace('SPAN_KIND_', ''),
                hexid(sp['spanId']), hexid(sp.get('parentSpanId')) or 'ROOT'))
Expect nine spans on the one trace ID, with GET /order-detail parented on the upstream span ID you sent. The actual output from the test run is in Section 16.2.
In Grafana, open Explore, choose the Tempo data source and search by trace ID. A trace started with a hand-made traceparent shows root span not yet received, because the declared parent never existed. That is expected.
16. Validation
The design was validated in two environments. The reference implementation (Section 10) established the root cause. The second environment (Section 13) tested the final code, exactly as listed in Section 15, against failure, load and misconfiguration.
16.1 Results
| Test | What it checks | Result |
|---|---|---|
| Reference, tests 4 and 5 | Spans leave the worker only when flushed | No Perl spans without the flush; all expected spans with it |
| A | End-to-end trace across Perl, MariaDB and Node.js | Nine spans on one trace; the server span is parented on the caller’s span ID; first request after start 30 ms |
| B | Control: the same code with the flush line removed | No Perl spans after 20 s; Node.js spans present |
| B2 to B4 | Alternative designs (Section 13.4) | Batch processor works only with first-request initialisation, at the cost of an extra process per worker |
| C | Controlled SQL error | Client: HTTP 500 with a generic body. Server span: STATUS_CODE_ERROR, an exception event and the full database error |
| D | 300 requests at concurrency 10 | 300 of 300 succeeded at 304 requests/s, p95 47 ms. 604 spans accepted: 600 expected plus 4 connect spans. No export errors. Workers added by prefork under load initialised themselves |
| E | shutdown versus force_flush | shutdown exported 0 of 3 spans while returning success; force_flush exported 3 |
| F | OTEL_EXPORTER_OTLP_PROTOCOL=grpc | Every worker logged tracing disabled; every request returned 200 at normal speed |
| G1 | Receiver stopped | Requests unaffected (5 to 29 ms); failure and recovery each logged once per worker |
| G2 | Receiver unreachable | Before the timeout fix: every request hung for more than 30 s. After: 2.03 to 2.06 s, HTTP 200 |
| G3 | ORDERAPP_OTEL_EXPORT_TIMEOUT=1 | Unreachable receiver costs 1.02 s per request |
| H | Latency, 300 sequential requests | Tracing off 1.1 ms mean; on, before TCP_NODELAY, 49.7 ms; on, final, 6.4 ms mean, p95 12 ms. 601 of 600 expected spans delivered |
| Regression | Final code after the last change | Test A passed; 300 sequential requests, 2.3 ms mean, 600 of 600 spans |
Span delivery was counted at the receiver, from Alloy’s otelcol_receiver_accepted_spans_total, rather than by searching Tempo. Tempo’s search over very recent data returned only a subset of the traces that had been accepted, which would have understated delivery.
16.2 Raw output: the end-to-end trace
The upstream traceparent was generated by the test; the GET /order-detail span’s parent is that upstream span ID.
TEST A  end-to-end trace (final code)  2026-10-16T10:25:28Z
upstream traceparent: 00-956a89699a8b07af8ba19bb1eb101011-38c0835fbca7a46e-01
[HTTP 200, client time 0.029745s]
order-api    GET                  CLIENT     span=d012eae251fce134 parent=67f8ee458ea18f40
order-api    GET /order-detail    SERVER     span=c48667119fcfaf5e parent=38c0835fbca7a46e
order-api    SELECT o.id, o.buyer CLIENT     span=cd8e4c7dac7b053d parent=c48667119fcfaf5e
order-api    connect              CLIENT     span=e106a81f6b3b99d1 parent=c48667119fcfaf5e
order-api    pricing.lookup       INTERNAL   span=67f8ee458ea18f40 parent=c48667119fcfaf5e
pricing-api  GET /price           SERVER     span=4d1dfbebadddcf7e parent=d012eae251fce134
pricing-api  middleware - express INTERNAL   span=aefee71b0b97c014 parent=4d1dfbebadddcf7e
pricing-api  middleware - query   INTERNAL   span=8c2ef4d9af1c251d parent=4d1dfbebadddcf7e
pricing-api  request handler - /p INTERNAL   span=8fbac655c936b09a parent=4d1dfbebadddcf7e
16.3 Raw output: concurrency, failure and latency
TEST D  concurrency: ab -n 300 -c 10 /orders (final code)  2026-10-16T10:20:50Z
Complete requests:      300
Failed requests:        0
Requests per second:    304.18 [#/sec] (mean)
Time per request:       32.875 [ms] (mean)
  50%     29
  95%     47
  99%     85
 100%    108 (longest request)
Alloy OTLP/HTTP spans accepted: delta=604 (expected 600 + one connect per new DB connection)
Apache processes before=6 after=7
export errors logged: 0
TEST G2  receiver unreachable (blackholed address), export timeout passed on every call (2 s)  2026-10-16T07:34:59Z
  before fix: every request hung > 30 s (curl limit reached, HTTP 000)
  GET /orders -> HTTP 200 in 2.055483s
  GET /orders -> HTTP 200 in 2.024823s
  GET /orders -> HTTP 200 in 2.025192s
  GET /orders -> HTTP 200 in 2.027189s
  log:
    [otel] span export failed in pid 513; spans dropped until the receiver recovers
    [otel] span export failed in pid 511; spans dropped until the receiver recovers
TEST H  latency, 300 sequential GET /orders (after 10 warm-up requests)  2026-10-16T07:37:10Z
  tracing OFF (SDK not initialised):     1.135 ms mean, p50 1 ms, p95 1 ms
  tracing ON, before TCP_NODELAY:        49.720 ms mean, p50 48 ms, p95 56 ms
  tracing ON, with TCP_NODELAY (final):  6.385 ms mean, p50 5 ms, p95 12 ms
  failed requests (final run): 0
  spans accepted by Alloy during final run: 601 (expected 600: server + SELECT per request)
final regression: 2.294 ms mean, p50 2, p95 3, failed 0, spans accepted 600
17. Troubleshooting Guide
When no traces appear, locate the failing layer before changing anything. Work from the backend inward: prove the backend can receive, then prove Perl creates spans, and only then investigate the gap between them.
17.1 Step 1: is the backend receiving at all?
Run tools/smoke-span.sh (Section 15.4).
- The span reads back: the receiver and store work. Do not change the backend. Go to step 2.
- It does not: the fault is in Layer 3. Check receiver ports, the exporter endpoint to Tempo, and Tempo’s
/readyendpoint.
17.2 Step 2: does Perl create spans?
Run the code from the command line with OTEL_TRACES_EXPORTER=console, which prints spans to STDERR instead of sending them.
- Spans print, correctly nested: Layer 1 works. The fault is in Layer 2. Go to step 3.
- No spans print: the SDK is not initialised, or no span is active.
- Spans print but as separate traces: context is not activated with
dynamicallyaround the child operations.
17.3 Step 3: are spans leaving the worker?
| Symptom | Likely cause | Fix |
|---|---|---|
| Spans created, backend empty, no error anywhere | No flush at the end of the request | Flush after writing the response |
Spans disappear at shutdown, and shutdown returns success | SDK 0.028’s batch processor discards its queue on shutdown | Use force_flush; never call shutdown per request |
Nothing exports, and initialisation code sees no OTEL_* variables | PassEnv instead of PerlPassEnv | One PerlPassEnv line per variable |
| Initialisation log line never appears at start-up | PerlChildInitHandler inside <VirtualHost> | Move it to server level |
| Every trace starts at the Perl service, ignoring the caller | extract() ran before the SDK was initialised | Initialise first, then extract |
| Requests take seconds, or hang | Exporter retries, or an export with no timeout | retries => 0 and an explicit timeout on every export |
| About 40 ms added to every request | Nagle’s algorithm and delayed ACK on a kept-alive connection | TCP_NODELAY on the exporter’s sockets |
Nothing exports; the endpoint ends in :4317 | HTTP payload sent to the gRPC port | Use port 4318 with http/json |
| Exporter or initialisation errors not visible | Messages go to Apache’s main error log | Check the main error log, not only the virtual host’s |
The most useful diagnostics are the receiver’s accepted-spans counter and OTEL_PERL_INTERNAL_LOG_LEVEL=trace passed through with PerlPassEnv.
17.4 Setup failures that resemble telemetry failures
| Symptom | Cause |
|---|---|
| HTTP 403 on every route | The handler directory is not granted in the Apache configuration |
| DBI connecting to a local socket | DB_HOST not passed through to Perl |
ER_SECURE_TRANSPORT_REQUIRED | The database requires TLS; add mariadb_ssl=1 and a CA file |
Can't locate object method "attach" | The Perl API has no attach; use otel_current_context with dynamically |
Address already in use when restarting Apache | An old Apache process tree is still running; stop it completely before starting again |
18. Performance Considerations
The per-request export is synchronous: it adds one HTTP call to the receiver to every request. The measurements below were taken on one host with the receiver local, using ApacheBench.
18.1 What was measured
| Condition | Mean | p50 | p95 |
|---|---|---|---|
| Tracing off | 1.1 ms | 1 ms | 1 ms |
Tracing on, before TCP_NODELAY | 49.7 ms | 48 ms | 56 ms |
| Tracing on, final design | 6.4 ms | 5 ms | 12 ms |
| Concurrency 10, final design | 32.9 ms | 29 ms | 47 ms |
These are local measurements for a database read with a join. The overhead of tracing, about 5 ms per request, includes span creation, DBI instrumentation and the export. A remote receiver adds its network round-trip to every request.
18.2 The cost of receiver problems
| Receiver state | Effect on each request | Evidence |
|---|---|---|
| Healthy | About 5 ms | Test H |
| Stopped (connection refused) | None measurable; spans dropped and logged | Test G1 |
| Unreachable (no response) | Up to the export timeout, 2 s by default | Tests G2, G3 |
The unreachable case is the one to plan for. During such an outage every request pays the timeout, and every Apache worker is occupied for that long. Set ORDERAPP_OTEL_EXPORT_TIMEOUT to what the service can afford, and run the receiver close to the application.
18.3 Options to reduce the cost further
| Option | Effect | Status |
|---|---|---|
| Run an Alloy or Collector agent on the same host or pod | Shortens the export round-trip; isolates the application from the central backend | Recommended; not separately measured |
| Lower the export timeout | Caps the cost of a hung receiver | Tested (Test G3) |
Flush from a PerlCleanupHandler | May release the client before the export | Not tested |
http/protobuf encoding | Smaller payloads than JSON; requires Google::ProtocolBuffers::Dynamic | Not tested |
| Head-based sampling | Fewer spans to export | Not tested |
19. Limitations
The final design passed every test in Section 16, in an environment built to reproduce the runtime. Read this section before relying on it under real traffic.
| Limitation | Consequence |
|---|---|
| Tested on reproductions of the runtime, at modest load | Behaviour at production traffic volumes, over long uptimes and across worker recycling is not yet measured |
| HTML::Mason not included | Instrumenting at a Mason syshandler with this design is untested |
| Only OTLP/HTTP with JSON tested | Protobuf was not tested; gRPC is not available from the Perl exporter |
| Only DBI (DBD::MariaDB) and LWP instrumented automatically | HTTP::Tiny instrumentation was not exercised. Memcache, session stores and other clients need manual spans |
| Tested with Grafana Alloy as the receiver | The design uses only standard OTLP, but no other receiver was tested with it |
| Container packaging not rebuilt in the second environment | The code and Apache configuration were verified natively; the Dockerfile is the reference implementation’s, with version pins added |
| The per-request processor exports synchronously | A hung receiver costs every request up to the export timeout (Section 18.2) |
TCP_NODELAY is set on all HTTP::Tiny sockets in each worker | Safe in practice, but it applies to the application’s own HTTP::Tiny use too |
| Pre-1.0 SDK, independently maintained | Version 0.028 at the time of testing, maintained in an independent repository. The API may change between releases |
| Base image | Debian 11 is an older release; check its support status before adopting it |
| Traces only | Metrics and logs from Perl were out of scope |
20. What This Investigation Taught Us
The first fix was one line of code: a flush. Nearly all of the difficulty lay in locating it, and the second round of testing found four more silent failures behind it. The lessons below are about finding such failures faster.
20.1 On diagnosis
- A tracing pipeline has three layers that fail independently. Instrumentation, export and backend are separate problems. A failure in any one of them looks the same from outside: no traces.
- A healthy collector proves only that the collector is healthy. Running receivers and pipelines say nothing about whether the application is sending anything.
- When many backends fail identically, look upstream of all of them. Eight approaches across seven vendors and projects produced one symptom. That uniformity was itself the strongest clue.
- Silence needs positive evidence. “The backend is empty” does not distinguish export failed from export never happened. Count spans at the receiver.
- Reproduce the runtime in miniature, then change one thing at a time.
20.2 On legacy runtimes
- The process model matters more than the language. The same Perl code exports from a script and fails silently under mod_perl.
- Know where your code runs, and what it can see there. Startup code runs in the parent, twice.
PassEnvvalues are invisible until a request arrives. A child-init hook inside a virtual host never runs. - Defaults hide defects. Every silent failure in this investigation was masked somewhere by a default that happened to be right.
- Defensive telemetry is a requirement. When the SDK dies on a configuration error, a NO-OP wrapper is the difference between losing traces and losing the server.
20.3 On evidence
- Check the exporter version before ruling a transport in or out. The JSON encoder defects had been fixed several releases before the original conclusion.
- Treat a pre-1.0 SDK empirically, and read its source. The missing
attachmethod, the unused schedule delay, the dropped queue on shutdown and the missing timeout were all found by probing and reading, not from documentation. - Test failure, not only success. The design worked in the first test of the second environment. The receiver-outage test then showed it could take a site down.
- Value the reply that questions the premise. The community reply that pointed out the encoder had no open issues was more useful than the reply that agreed with the conclusion.
- Keep failed experiments. The experiment matrix is what makes the root cause legible.
21. Future Work
21.1 Validation
- Sustained load. Run long-duration load at production volumes, including worker recycling (
MaxConnectionsPerChild) and graceful restarts. - HTML::Mason. Apply the design at a Mason syshandler.
- Other receivers. Run the same tests against other OTLP receivers and vendor endpoints.
21.2 Engineering improvements
- Measure flushing from a
PerlCleanupHandler, to release the client before the export - Test
http/protobufwith Google::ProtocolBuffers::Dynamic, including ahead-of-time generation withprotoc-gen-perl-gpd - Add an automated test that builds the images, sends a request with a known
traceparent, and asserts the expected spans at the receiver
21.3 Contributions upstream
- Report the SDK findings: the unused
OTEL_BSP_SCHEDULE_DELAY,shutdowndiscarding the queue, and the exporter’s missing default timeout - Update the JSON encoder issue with the root cause found here, so that it does not mislead others
- Contribute mod_perl deployment guidance to the Perl SDK documentation:
PerlPassEnv, server-level child-init and per-request export - Publish the per-request processor as a reusable module, together with a mod_perl server-span helper
- Report the finding on the Perl Monks thread, which currently records a conclusion of infeasibility
22. Conclusion
Distributed tracing for a Perl application under Apache/mod_perl is achievable with the existing OpenTelemetry Perl SDK. The obstacle was not the language, the encoder or the backend: spans created inside each Apache worker were never sent.
The original conclusion was reasonable from the evidence available. Instrumentation worked, the Collector was healthy and the backend was empty, and a transport limitation explained all three. What that evidence could not show was that export was never attempted. Every backend tried afterwards inherited the same invisible fault, and so every one of them failed.
The reference implementation made the fault visible by reproducing the runtime and changing one variable at a time. A second, independent environment then tested the design against load, failure and misconfiguration, and found four more silent failures. With those fixed, a single trace spans Apache/mod_perl, database queries, an outbound HTTP call and a second service in another language, at about 5 ms per request, without risk to the application when tracing or its receiver fails.
For teams maintaining Perl applications, tracing can be adopted incrementally, without rewriting the application. Section 15 is the complete starting point.
References
OpenTelemetry and Grafana
- OpenTelemetry. Zero-code instrumentation — agent-based instrumentation mechanisms by language.
- OpenTelemetry. Java agent — zero-code instrumentation for Java.
- OpenTelemetry. Tracing SDK specification — ForceFlush guidance.
- Grafana Labs. otelcol.receiver.otlp — Alloy’s OTLP receiver as a wrapper over the upstream Collector receiver.
- Grafana Labs. Grafana Alloy repository — Alloy as an OpenTelemetry Collector distribution.
- SigNoz. What are OpenTelemetry auto-instrumentation agents? — Java and Python agents.
mod_perl
- Apache Software Foundation. mod_perl 2.0: Server Life Cycle Handlers — startup ordering, double execution at startup,
PerlChildInitHandler,ENDblocks in parent and children.
Perl OpenTelemetry
- J. J. Atria. OpenTelemetry-Exporter-OTLP Changes — JSON encoder fixes in 0.014 to 0.016; 0.021 as the current release; internal logger.
- J. J. Atria. OpenTelemetry-SDK 0.025 — initialisation errors are fatal; JSON fallback; minimum Perl 5.30.
- J. J. Atria. OpenTelemetry::SDK::Trace::Span::Processor::Batch — batching,
force_flush, behaviour after shutdown. - J. J. Atria. OpenTelemetry::SDK::Trace::Span::Processor::Simple — synchronous processor and the processor interface.
- J. J. Atria. perl-opentelemetry-sdk Changes — batch processor background loop.